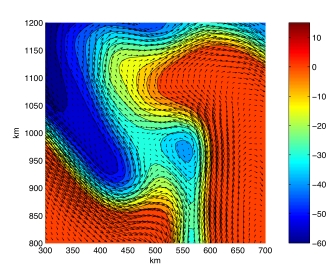
The figure to the right was produced from a numerical computation that
tested a timestepping method and other algorithms for solving a system
of partial differential equations that describes large-scale ocean
circulation. It is similar to a black-and-white figure in the 2005
JCP paper listed below. The curves and varying colors represent a
contour plot of the height of the free surface at the top of the
fluid, and the arrows represent the horizontal fluid velocity. In the
color bar, the units are centimeters. Due to the effects
of the earth's rotation, the horizontal velocity is approximately perpendicular
to the horizontal pressure gradient, which means that the fluid flows
along curves of constant elevation.
A larger version of this plot can be obtained
here.
This test computation was performed on a square spatial domain;
a black-and-white contour plot for the entire fluid domain is given in the
next figure.
 Office: Kidder 294B