The example shown on this page is presented at this page as you will see your own unknown.
|
1. The mass spectrum is always the place to start; you must find out what the substituents are (and generally, what the molecular formula is): All of your unknowns are disubstituted benzenes, so you know part of the formula is C6H4. You want to find the largest nominal mass (based on an understanding of the presence of heavy isotopes), look for characteristic patterns for Cl or Br, examine major fragmentations by differences with the parent ion mass and identify what is present in addition to the aromatic core. |
|
2. The one-dimensional 1H and 13C spectra of 2-chlorotoluene: To the extent you can, you want to analyze any clearly separated peaks for their coupling constant patters and extract J values. For your unknowns, the most common ones to look for are dd, td, and occasionally ddd. Coupling to fluorine will complicate each peak (note: the presence of an 19F spectrum in your packet is a big hint that fluorine is present!). |
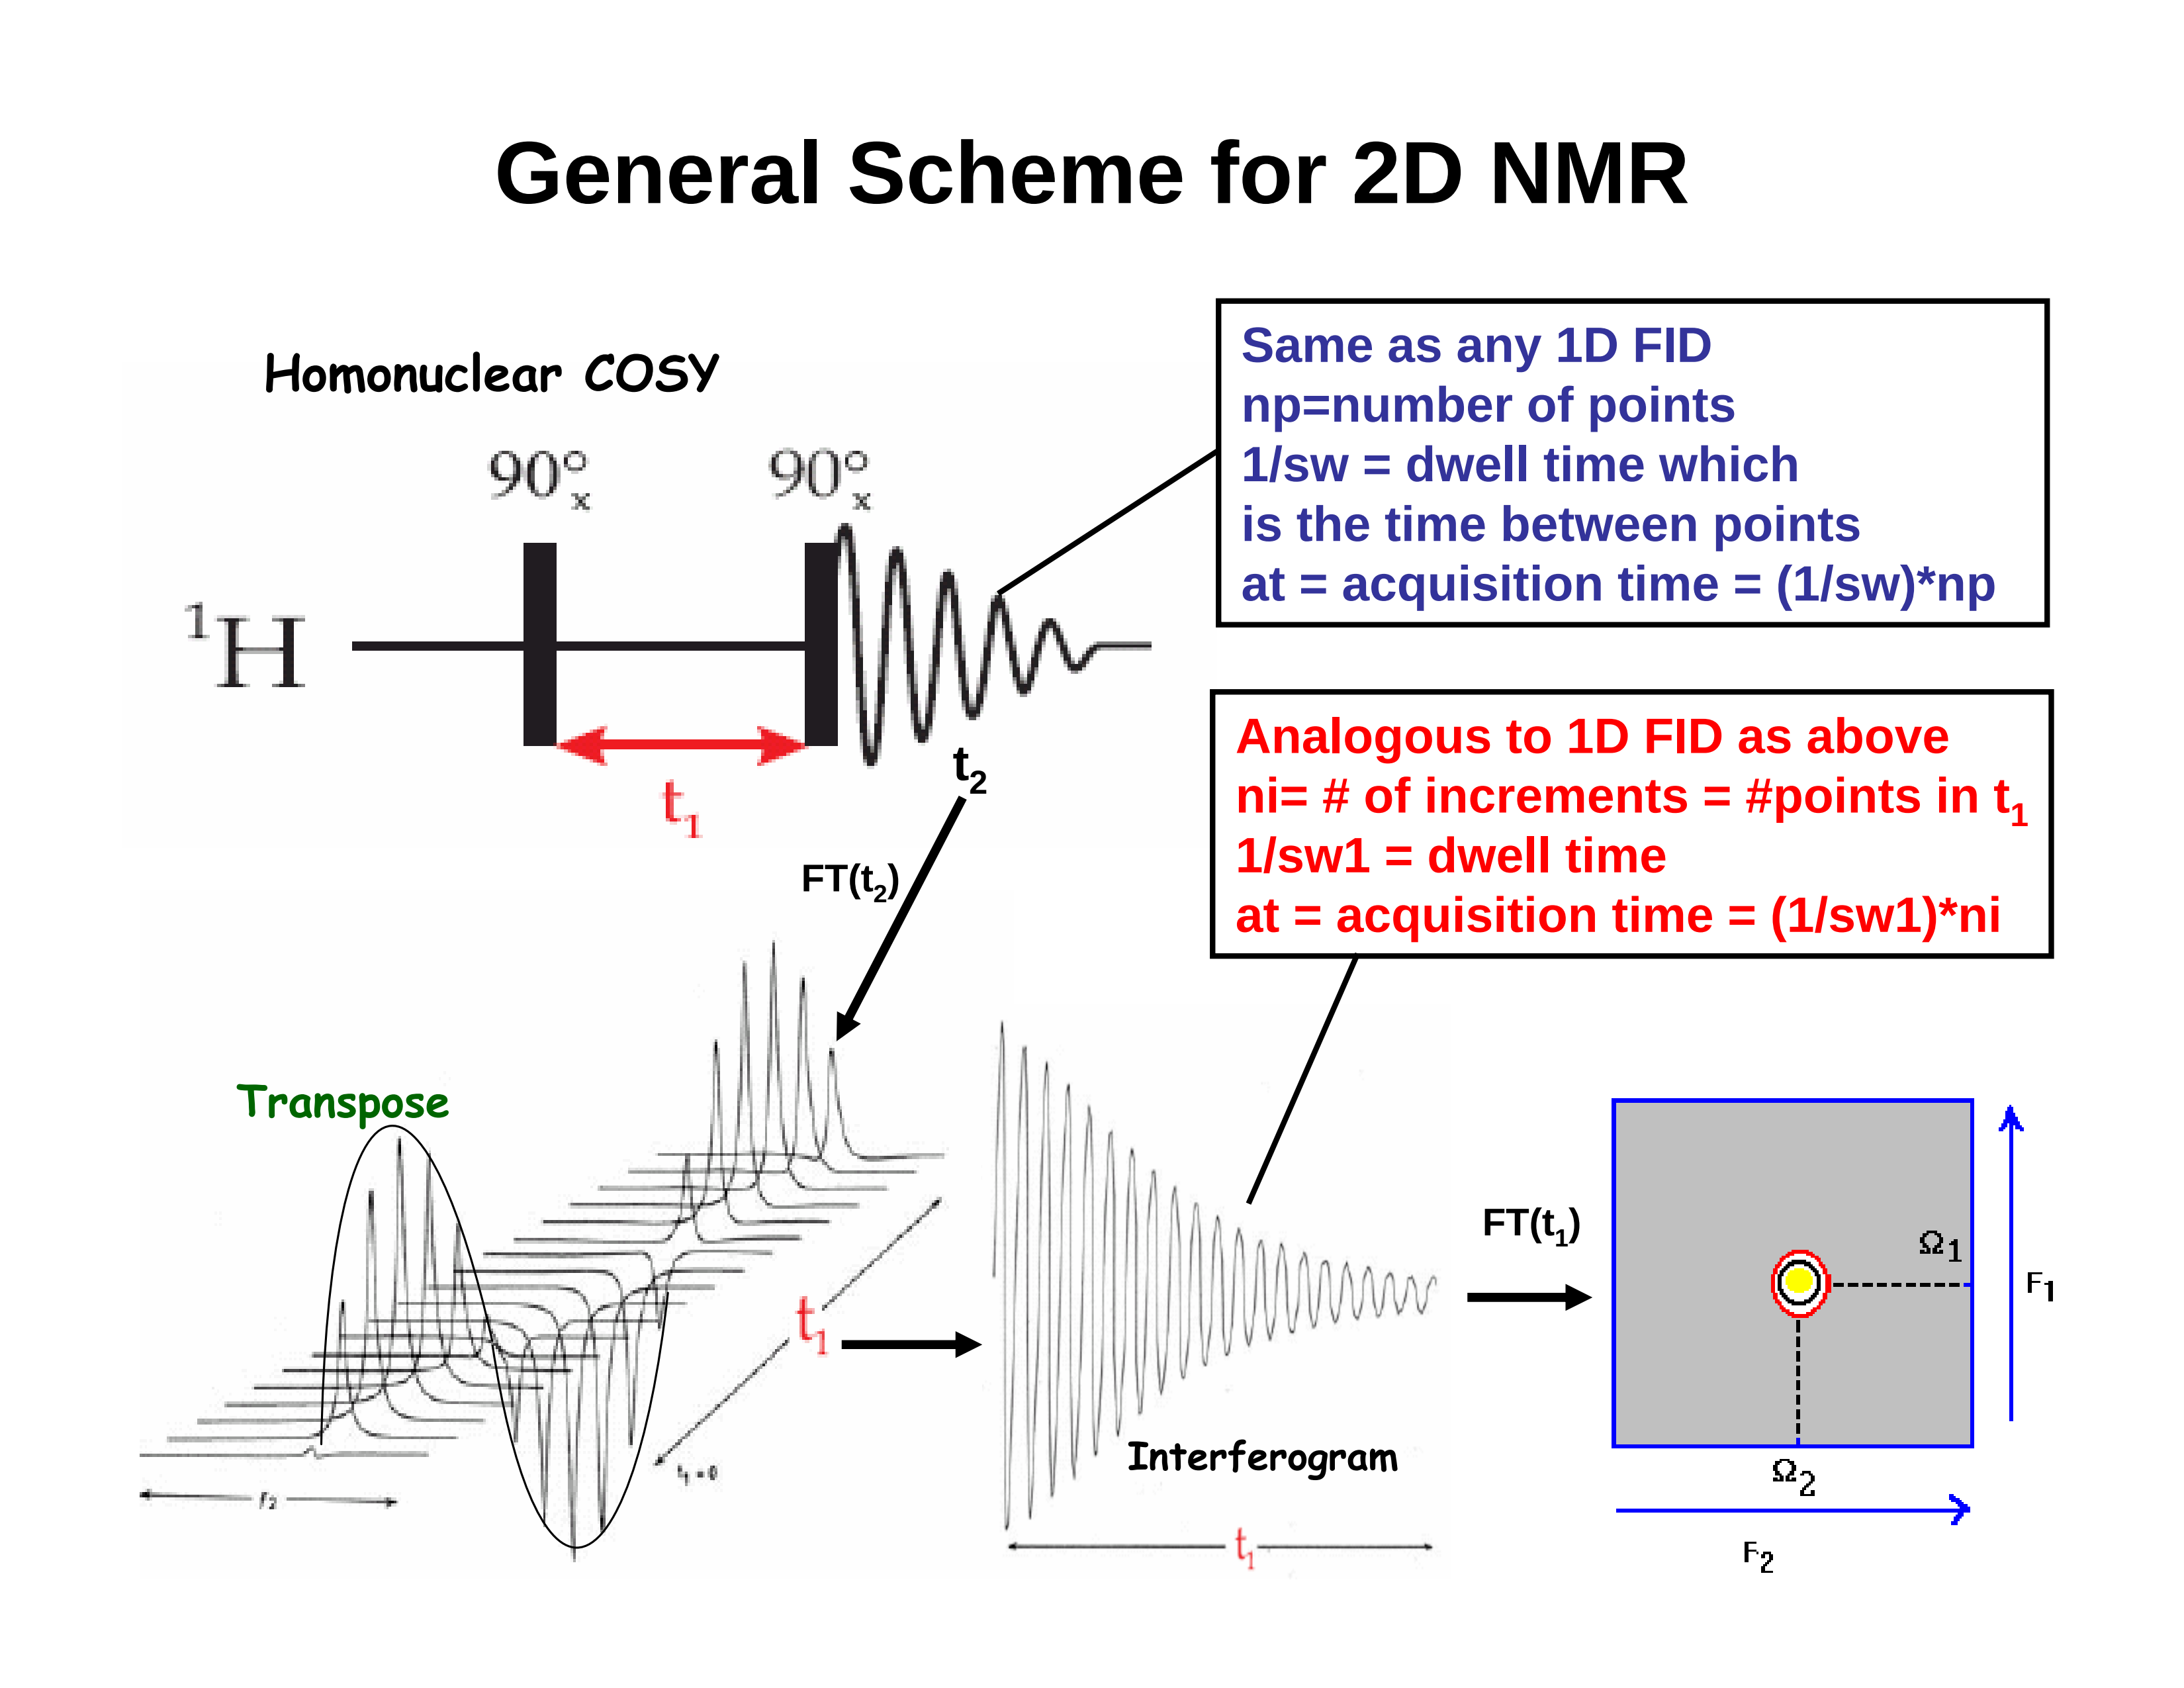
3. The 2D Experiment:

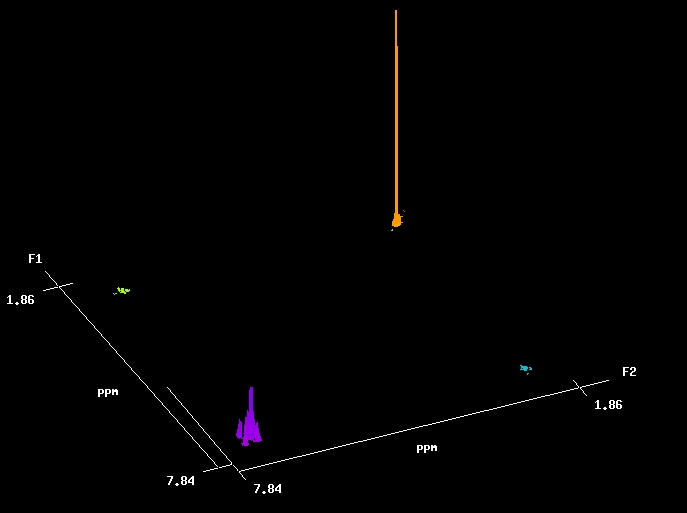
A 2D COSY (COrrelated SpectroscopY) spectrum. The off-diagonal peaks arise from coupling between protons; the higher the peak, the stronger the coupling (the larger J is). In addition to coupling among the aromatic signals (see expansion, 3 below), we can see some very weak coupling between the methyl signal and an aromatic proton. This is <<1 Hz. The "normal" 1-D spectrum appears along the diagonal.
Top: a "stacked plot" view, emphasizing the 3-dimensionality of the
spectrum.
Bottom: a more conventional contour plot; the view is "looking down" on
top of the stacked plot.
 |
4. A closeup of the aromatic region showing 1H-1H coupling. The ortho and meta couplings are easily detected; some very weak para coupling is barely visible.
5. An HSQC (Heteronuclear Single Quantum Corelation) spectrum showing 1H-13C coupling. Bottom: a closeup of the aromatic region.
5. A final very useful feature is the ability to look at a "slice" of the HSQC spectrum. This shows the multiplet pattern of the proton attached to the carbon we are examining. We use the 13C signal to reveal the spectrum of only the 1H attached to it! This allows us to pull apart overlapping multiplets. Be careful, though, since low digital resolution will prevent us from seeing small splittings (<5 Hz).
Back to NMR page
Back to CH 362 Home page
Last updated: 12/17/2014