You are here: start » whitepapers » sequences » veff
Reconciliation of Effective Potentials with Orbit Shape
A valuable sequence of activities arises during our discussion of classical orbits that illustrates how computational work must be integrated with other activities to achieve the pedagogical goal. We would like our students to understand how the shape of the orbit depends on various physical parameters such as reduced mass or the z-component of angular momentum and how this shape can be predicted by an effective potential diagram.
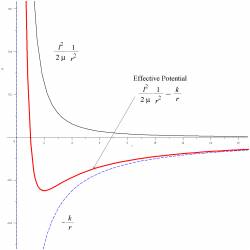
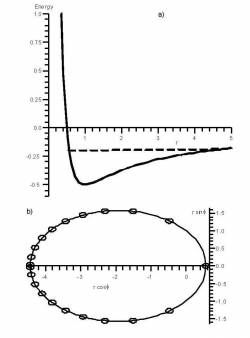
| We start with a fairly traditional mini-lecture that reviews 1-dimensional potential energy diagrams (emphasizing classical turning points and the graphical interpretation of kinetic energy). We leave a labelled potential energy diagram on the board. The mini-lecture continues by deriving the formula for the effective potential and drawing an effective potential diagram next to the potential energy diagram. Students are then asked to explore, in small groups, how the shape of the effective potential diagram, shown in Fig. 1, depends on the various parameters. This is a case where it is valuable to use a (prewritten) worksheet in a computer algebra package such as Maple or Mathematica, rather than a prettier, but “black box” simulation such as a Java applet, so that students can actually see the mathematical expressions that are being plotted. Next, ideally we would like to show the students another computer visualization activity that integrates the equations of motion and plots both the effective potential and the corresponding orbits, as in Fig. 2. Here, a black box simulation is fine; the details of the numerical solution of the differential equations are a significant enough departure from the main flow of this particular course that we choose not to address them. | Figure 1: Figure 2: Figure 2: |
Originally, we had a single, long Maple worksheet that first showed the effective potential, and then showed the orbit for any set of physical parameters. Unfortunately, without intervention, many students did not immediately see how these two different graphical representations were related to each other. We now address this issue by interposing the following kinesthetic activity. A single student, carefully chosen to be someone who will be comfortable with being put on the spot, is asked to come to the front of the room to act out the part of the orbiting planet while the teacher plays the part of the sun. Most students, on their first attempt, will walk around the teacher—after all, this is what planets do. When directed to refer to the effective potential diagram, with its apparent classical turning points, most students, on their second attempt, will move towards and away from the teacher in a straight line, with an embarrassed laugh for the obvious absurdity of their motion—this is not what planets do! It takes a significant class discussion to bring out the role of the angular momentum in resolving the apparent paradox. After this classroom experience, most students are more effective at using the computational simulation to explore the shape of the orbits in depth. For example, a common question that now arises is how one knows where in the orbit the minimum and maximum radii occur.