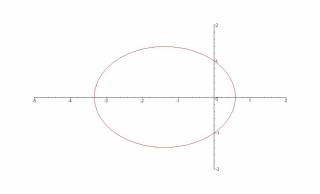
Plotting Conic Sections
Highlights of the activity
- This computer visualization activity is designed to help students visualize various plots of conic sections in polar coordinates.
- Students use a Maple Worksheet or a Mathematica Notebook to generate polar plots of orbits while exploring the parameter space of the orbits.
- The whole class wrap-up discussion addresses how the shape of the orbits depend on a variety of geometric parameters.
Reasons to spend class time on the activity
- Students learn about how polar plots are generated
- Students become familiar with the equations for conic sections in polar form
- Students learn to explore parameter space and develop experience with how various terms in the equation affect the shape of the plot
- Students learn how to use Maple or Mathematica to generate a polar plot
This activity works particularly well when sequenced with other activities.
Reflections
Instructor's Guide
Student Handouts
Maple Worksheet
cfconics.mw (Maple 13)
cfconics.mws (Maple 11 Classic)
