You are here: start » days » fall2009daybyday » fall2009day12 » heatandwatertemperature
Mixing Hot and Cold Water
Navigation Links
Fall 2009-Day 12
Heat and Temperature Activities
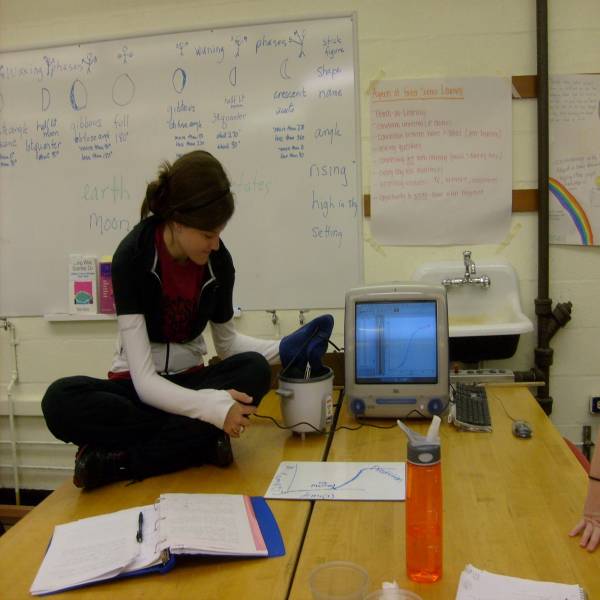
In two groups, the students put ice into a pot that was on a hot burner. They watched the temperature rise with a thermometer. The ice instantly began to melt into liquid form. Once it was all liquid(water), the temperature plateaued for a moment before it started to steam and turn to the gaseous state. Once the water started to turn to steam, the temperature stopped rising. It did not quite reach 100 degrees Celsius. One group found this to be particularly interesting. They associated this to the water having impurities in it. The impurities have different boiling points alone, so mixing the two (water and the impurities) must cause a new/different boiling point to come about.
 | Instructor: She is using a digital temperature probe placed in a rice cooker initially filled about a third full of ice cubes. The temperature probe is connected to a computer and the computer displays the graph of temperature versus time as the ice melts, the water warms, and begins to boil. Her science notebook is open ready to record her observations and wonderings. Group members have sketched the graph on a small white board for discussion. I like this picture because it shows other aspects of our class as well - The photo shows not only one of the activities with the digital probeware we use (temperature probes, motion detectors, and light sensors from www.vernier.com) but also the study of the moon's phases on the board with the stick figures showing the angles formed by pointing one arm at the sun and one at the moon when both are visible, the chart of Aspects that Foster Science Learning on the wall that the students constructed on the first day of class, a corner of a chart, with a rainbow, that students drew to document what they knew about light when we started that topic, the open science notebook in front of the student, the small whiteboard with a sketch of the graph, and the books about teaching science on the whiteboard ledge (“Doing What Scientists Do” by Ellen Doris and “The New Science Literacy” by Bennett Daviss and Marlene Thier. |