Level Sets
It is important to distinguish between two quite different situations: Some surfaces describe actual regions in space, while others are merely the graphs of functions of two variables. One can talk about the “volume” under the surface in either case, but only in the first case is it really a volume, with the correct units.
Even more importantly, one must distinguish between what is being integrated and where one is integrating. In both cases just described, the integral is over a two-dimensional domain, typically a region in the $xy$-plane. An entirely different problem would be to find the total mass of a region in space, in which case one would integrate over a three-dimensional domain, namely the region itself. It is of course not easy to draw the graph of a function of three variables…
There is another representation of functions of several variables which is often easier to understand, namely to use level sets, which consist of places where the function is constant. A good example is a topographic map, which represents (say) the height of a hill by drawing contours of constant height. This is an entirely two-dimensional representation of this function of two variables. In this particular case, this representation can be counterintuitive; after all, the hill really is three-dimensional, so the graph really does represent the physical hill. But what about a weather map, showing lines of constant temperature or atmospheric pressure? In this case, it is the graph which is counterintuitive — the problem is really two-dimensional, so why not use a two-dimensional representation? Each such contour line is called a level curve.
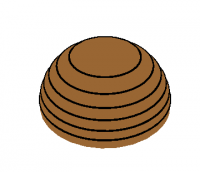
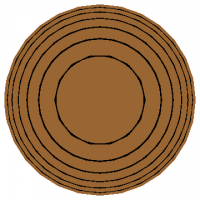
Some level curves for a hemisphere are shown in Figure 1, shown first as curves drawn directly on the three-dimensional surface, then as a topographic map in the plane. You can think of the latter as the view from above, or equivalently as the projection (or “flattening”) of the three-dimensional view. Notice that the level curves are closest together where the surface is steepest.
Level sets can also be used in three dimensions, where they are called level surfaces. One way to represent the temperature in a room would be to put a colored dot at each point, with each color denoting a particular temperature. This representation makes it easy to distinguish “what” (color) from “where” (the room).