Directions for the Gaussian Modeling Program
The PC's in GBAD 311 and 416 have the Gaussian09 for Windows program setup. The following
directions are intended to get you started-for advanced applications consult the Help
menus and the manual in GBAD 311. The topics covered in this handout are: construction of
a molecular structure, geometric optimization for the structure, generation of the
infrared spectrum, and animation of the virbrational modes. (The last two parts are only
for demonstration.) It is easy to learn how to do
things by just trying something. There is on-line help on the (surprise!) Help menu.
Open the GaussView program.

You will get two windows: a molecule window (empty initially, light blue background) and a tool palette (initially showing a tetrahedral carbon). To build a model, adjust the palette window so the correct atom & geometry are showing, then left-click in the molecule window. The selection will appear. If you take the mouse off the molecule, you can change orientation by left-click-and-dragging.
Sketch a Molecular Skeleton
1. Select the atom and geometry you want; tetrahedral carbon is the default.
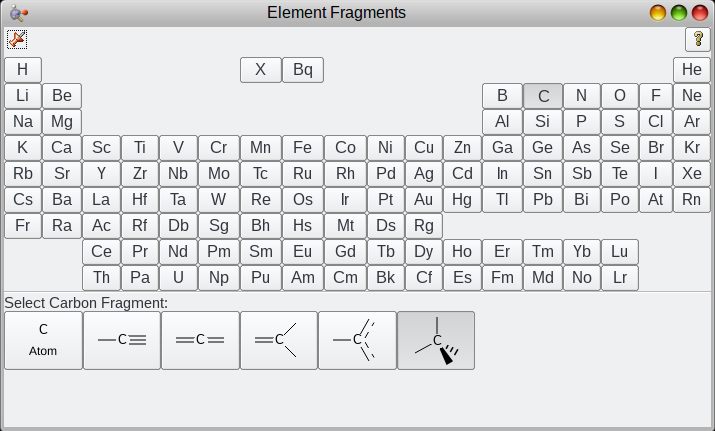
If you click on "Carbon tetrahedral" in the palette window (or "Builder; Element Fragment" from the menu) you will get the following window where you can shoose something different:

2. Go to the molecule window, and left-click to place an atom. To add atoms to form a chain, left-click on a terminal valence (hydrogen, by default) to extend the chain. To conveniently make a ring, select the ring tool:

To add a functional group, use the "Group Fragment" tool right next to the Ring tool in the palette window.
3. Sketch out your molecule. You may want to move it around; left-click & drag rotates it; middle-click & drag shifts it; ctrl-left click & drag zooms in & out. If you make a mistake, you can erase atoms one by one:

or just close the molecule window and start over ("File; New Molecule Group").
4. You will likely want to adjust one or more dihedral angles. Select the dihedral tool:
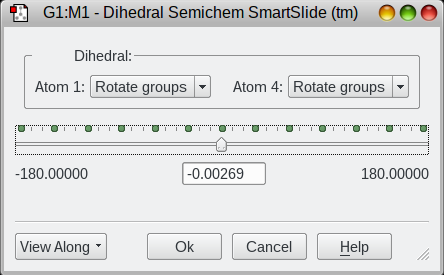
and then select the 4 atoms (in a row) that define the dihedral angle. This will generate a new window that allows you to set it as you like:


Use the slider or type a number on the center box. You’ll need this to explore conformational preferences for the ester group (relative to the C=O) and the ester relative to the ring.
5. Once you have the molecule where you like it, save it in case you have to leave and come back to it. "File; Save." Use the .gjf extension.
Calculations
Find the Geometrically Optimized Structure. This usually produces a structure with a lower heat of formation than that which is produced from the automatic Build function. This optimization should be done for all serious work.
6. Select Calculate, Gaussian Calculation Setup. A new window with several tabs pops up.

7. The first tab, "Job Type," has one menu bar. Select "Opt+Freq". This will generate an optimized geometry and allow you to compare its energy to other conformers. This will also calculate the normal modes of vibration and thus the IT spectrum. There are an array of things that can be varied, but do not make any changes here other than the job type.
8. Go to the "Method" tab. You will be calculating the Ground State, but change from Hartree Fock to Semi-empirical. You want to keep Default Spin, and PM6 is a good methods to use--it will give you a good geometry. It is fast, though at the expense of some accuracy (as we will see when we look at IR frequencies). The charge should be 0 and the spin state is a singlet. (If Gaussian predicted anything else, you likely have an extra atom or valence!)
9. You can place a Title in the appropriate tab, but none of the other tabs need to be messed with.
10. Click on Submit, and answer Yes to all the dialogs (overwrite the file and submit to Gaussian). You can view the results as they are calculated using "Results, Stream Output File." The calculation should finish in under a minute. The output file contains a large amount of detail, but the process is done when you see a block of text like this:
       MORNING PEOPLE ARE USUALLY ADMIRED AS EARLY BIRDS.
RECALL BEN FRANKLIN'S APHORISM THAT THE EARLY BIRD GETS THE WORM.
I IDENTIFY WITH THE WORM. -- CRAIG JAGGER, MINNEAPOLIS, KS.
Job cpu time: 0 days 0 hours 0 minutes 23.4 seconds.
Elapsed time: 0 days 0 hours 0 minutes 23.5 seconds.
File lengths (MBytes): RWF= 106 Int= 0 D2E= 0 Chk= 10 Scr= 1
Normal termination of Gaussian 16 at Wed Dec 27 13:43:18 2017.
There will also be a dialog asking you to open a window for the optimized molecule; you should do so (and close the original molecule window).
11. The actual results are most easily seen by selecting "Results, Summary." The energy is expressed in a unit called Hartrees, so look for a line that says E(AM1). The number here needs to be converted to a more standard thermodynamic unit:
1 Hartree = 1 A. U. = 627.5 kcal/mol = 2625 kJ/mol
You may save the summary to a file.
Alternatively, look in the log file for the following block ("Edit, Find" and search on SCF)
SCF Done: E(RPM6) = -0.180897117182 A.U. after 8 cycles
The last one you find is the optimized energy.
You might wish to browse the output file in order to see the information that is generated; it's a lot of digging and there are better ways of getting this information.
Now do a PM6 calculation on a series of conformational variants. For each one, change a dihedral angle: the H-C-C=O angle, for example; each of the C-O single bonds. Be sure to do both axial and equatorial cyclohexanes for the H ester (may require a new build from scratch). Compare the PM6 energies to find the lowest energy conformer of each ester. The energy difference between the lowest energy conformers of each molecule is the predicted strain energy.
Calculate a Theoretical Vibrational Spectrum and Animate
12. Select "Results; Vibrations." At the bottom of the window, select "Spectra" and a calculated IR spectrum will pop up. We need to note two things: the scale is reversed from what you have seen experimentally; and the spectrum is in Absorbance rather than Transmission (peaks point up instead of down).

13. Click on a peak (what do you think the strongest peak ought to be?), then click on "Start Animation". Is this what you thought it would be? You can select different peaks either from the table or from the spectrum and see what the actual vibration is. You might wish to identify the two C-O single bond stretches, or visualize some of the different C-H combinations or other fingerprint bands.
14. You can save a picture of the spectrum ("Plots, Save Picture"...a PNG file is usually pretty good) and/or the table of frequencies ("Plots, Save Data"). Compare the calculated spectrum to your experimental spectrum for each compound.
15. OPTIONAL: A more accurate prediction of the IR spectrum can be obtained using a higher level of calculation (using DFT, or Density Functional Theory). However, this requires more time; the calculatiuon will run in 20-30 minutes. Open the optimized structure for the lowest energy conformer of one of your isomers. Set up the calculation using the following settings:
- Set the Job Type to Frequency.
- Change Method from Semiempirical to "Custom".
- For the Basis Set, select "cc-pVDZ".
- In the "Additional Keywords" box at the bottom, enter BLYP. This is the "Custom" calculation method; it's actually quite
good at estimating IR frequencies for good geometries.
- Finally, go to the "Link 0" tab and find the "Shared Processors" line. Set this to 4 (the number of threads running in t
he GbAd laptops) if it's not already set. If you don't do this, the calculation will take 4 times as long.
Hit submit; save as a new name and hit "Yes" to submit. This should take about 20-30 minutes unless you forgot to set the numbe
r of shared processors.
Rendering Electronic Orbitals
16. To display a couple of relevant molecular orbitals, you need to use the checkpoint file. Open this ("File, Open" will list the files in your directory; select the one with the .chk extension). You can use either the AM1 result or the BLYP result as the MOs will be qualitatively similar. Go to "Results, Surfaces/Contours." A new window pops up.

17. You now must generate what's called a "Cube file". In the top block of the new window, select "Cube Actions" and "New Cube." Select Type Molecular Orbital, and select "HOMO,LUMO." It takes a few seconds for the cube file generation to complete.
18. When the generation of the surfaces is done, there will be entries for each MO in the top block.
Select the LUMO (the one with the higher MO number). Go to the second block "Surface Actions", and select "New surface." This will give you a representation of the MO. The LUMO most clearly illustrates the interaction between the carbonyl carbon and the adjacent oxygens.
19. The HOMO is not as informative (it's a combination of oxygen lone pair and sigma electron density.
You can examine other MOs by making a new cube file with all the MOs; this takes a while.
20. You can save an image of the MO surface ("File, Save Image"). Again, a PNG file is probably best.
The primary goal of this for your report is the energy difference between the two isomeric ester; this corresponds to the strain energy and provides a comparison for your experimental value. The IR analysis may provide some insight into differences in how the ring interacts with the C=O bond; the MO visualizations should reinforce this.
You want to make comparisons between the two isomers: is the LUMO localized or spread out? A more spread out orbital suggests delocalization of electrons, which will change the energies of the electrons involved. Consider this as you evaluate the strain energy that this exercise predicts.
Back to CH362 Home Page
Comments to K. Gable


