Varian EM360

(Page 2)

nmr1.gif (5397 bytes) nmr2.jpg (21925 bytes)
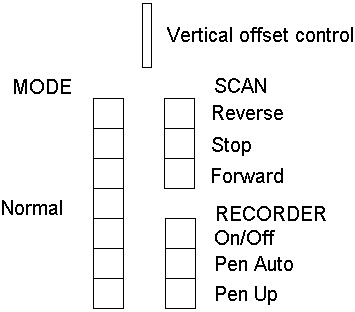
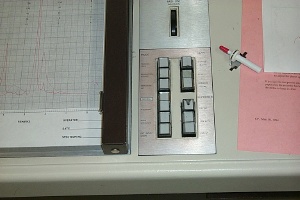
The recorder controls are next to the chart.  There is a wheel control to adjust the vertical offset.  The right column contains scan direction controls and pen behavior controls.  Be careful when using these because pushing these pushbuttons too hard will make them stick.

If the Scan control is on Off, you can manually scan by moving the pen bar back and forth.

nmr2.gif (6157 bytes) nmr3.jpg (17654 bytes)
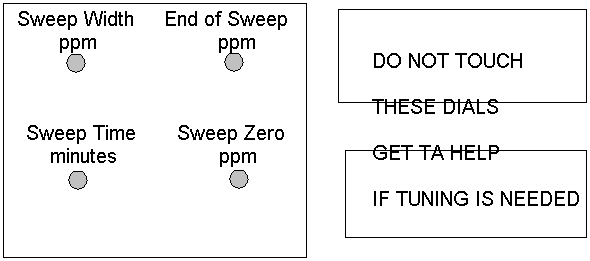
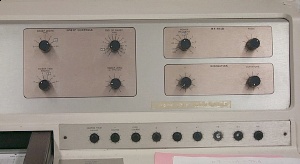
The field controls are on the vertical panel above the chart controls.  You will only use the Sweep controls in the middle.  These control the width of the spectrum, where the right hand side of the spectrum will be, and the sweep speed.  Set the width and end of sweep to place your area of interest on the chart.  For example, if you want to expand a 2-ppm region from 1.5-3.5 ppm, you would set Sweep Width to 2 ppm, End of Sweep at 1 ppm, then you would manually scan to make sure the peaks of interest were on scale.  Fine adjustment with Sweep Zero is usually needed.

For a "normal" 10ppm spectrum, the reference peak (TMS) is oriented onto the chart zero this way.  It is best to use a "scratch" sheet to set up the spectrum before using a good sheet of clean paper to record your desired spectrum.

nmr3.gif (3565 bytes) nmr4.jpg (13875 bytes)
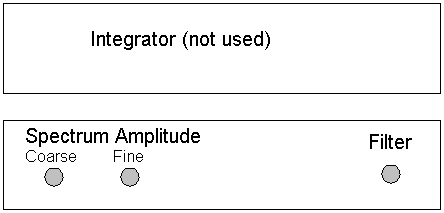
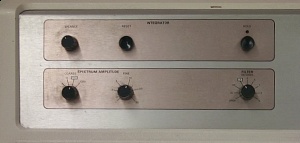
You want to adjust the Spectrum Amplitude to place the largest peak at full scale.  Be sure to manually sweep slowly enough to approximate the mechanical scan.

When you finish, remove your sample from the probe, and place a scratch sheet back on the recorder.


Back to CH 362 Home page

Last updated: 12/19/2000