Aliphatic Compounds
3-Phenylpropanoyl Chloride
Butanoic Anhydride
Ethyl Acetate
Acetamide
Sodium Butanoate
Hexanenitrile
Aronmatic Compounds
p-Toluyl Chloride
Benzoic Anhydride
Ethyl Benzoate
m-Toluamide
Sodium Benzoate
m-Toluonitrile
IR Spectroscopy
Load the IR Spectrum
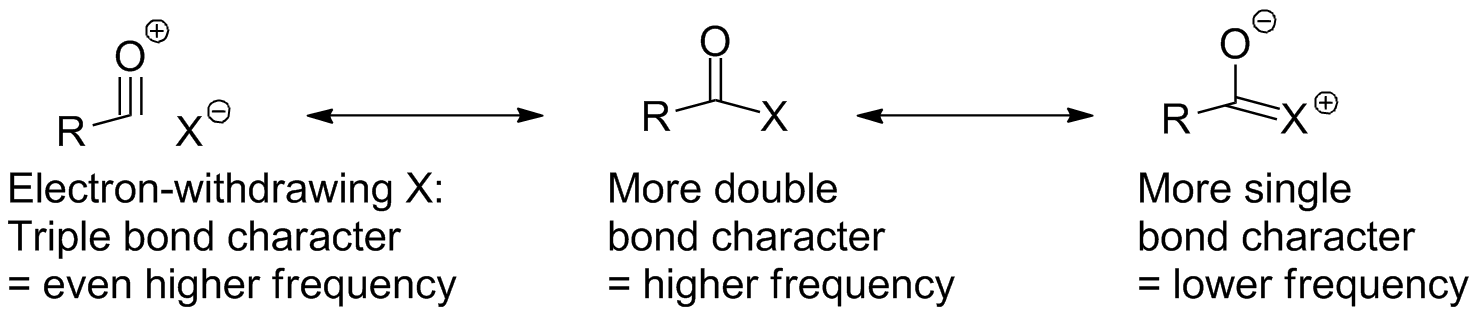
Caboxylic acid derivatives all (with the exception of nitriles) show a C-O stretch as the strongest band in the spectrum, and the frequency can often be used to identify which derivative we deal with. Load the molecules to the left and sequentially identify the C=O peak for each of the aliphatic derivatives. The characteristic regions and behaviors (in cm-1) are:
- Acid chlorides: 1790-1815
- Acid Anhydrides: 1740-1790 & 1800-1850
- Esters: 1735-1750
- Amides: 1650-1690
- Acid salts (carboxylates): <1600
Other parts of the molecule will have the extected behavior: amide N-H's come at the same place as amine N-H stretches; esters have C-O single bond stretches (again, these are difficult to identify). Nitriles, of course, show the C-N stretch at 2250-2150 cm-1.
1H NMR Spectroscopy
Load the 1H NMR
Since most derivatives (other than maybe amides) lack protons directly on the functional group, the 1H NMR is used more indirectly. The "pieces" look like other groups: the group connected to the carbonyl looks much like the corresponding carboxylic acid (lacking the COOH proton); an ester will liik much like an ether; an amide will look much like an amine. Assignment of the structure is largely a process of "putting together all the pieces."
Click on any signal to highlight the proton responsible for it.13C NMR Spectroscopy
Load the 13C NMR spectrum
The carboxyl carbon appears at a characteristic shift between 160-185 ppm just like carboxylic acids do. (Nitriles are the one exception; these sp-hybridized carbons come at 100-120 ppm.) It is often weak because of nOe effects on other carbons in a proton-decoupled spectrum. The rest of the molecule gives rise to the same kinds of peaks in the carbon spectrum that are seen in the 1H NMR.