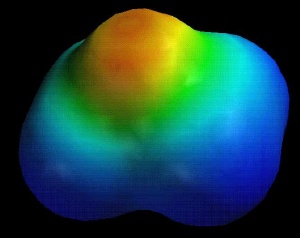

EtO.pdb
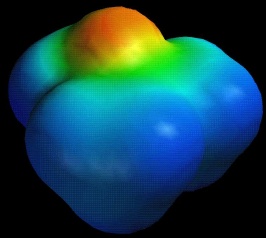
iBuO.pdb
The electronic effect of substitution has a dramatic impact on the chemistry of epoxides.
Compare the electrostatic potential maps for ethylene oxide vs. isobutylene oxide. Note the difference in the degree of negative potential at oxygen (red/orange).
 |
 |
|
EtO.pdb |
iBuO.pdb |
Nucleophiles will attack at the sterically most available carbon.
Look at the Spacefill to see the Van der Waals
Radii to compare the steric properties of ethylene oxide versus isobutylene oxide.
Click to restore to wireframe model.
Now look at what happens upon protonation of three epoxides:
(Energies are calculated in the vacuum at the AM1 level, and are expressed in kcal/mol)
| Property: | Energy before protonation | Energy after protonation | Energy of protonation | Structure | C-O bond distance |
| Ethylene oxide: | -8.955 | 181.04 | +189.97 | EtOH+.pdb | 1.53 |
| Propylene oxide: | -15.698 | 168.403 | +184.10 | PrOH+.pdb | 2.29, 1.41 |
| Isobutylene oxide: | -20.471 | 137.476 | +157.95 |
iBuOH+.pdb |
2.31, 1.42 |
Note the significant stabilization of the protonated isobutylene oxide vs. protonated ethylene oxide. This is caused by the electron-donating properties of the methyl groups. In an acid-catalyzed epoxide ring opening, the nucleophile will attack the carbon that bears the most positive charge. From these results, that will clearly be the most substituted carbon.
Back to CH630 Home Page
