XY GRAPH TUTORIAL
INTRODUCTION
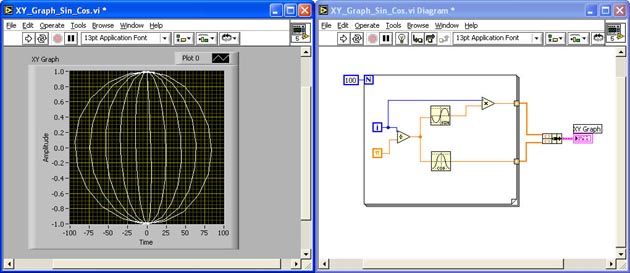
In this simple exercise, you will create a VI that will create a VI that displays a Sine and Cosine function on an XY Graph
- Start a New VI
- Place an XY Graph on the Front Panel
- Create a For Loop Programmed for 100 Iterations
- Add the Sine and Cosine Functions Inside the Loop
- Add the Numeric Multiply and Divide Functions to the Block Diagram
- Add a Bundle Function to the Block Diagram Outside the Loop
- Wire As Shown
- Run the VI and Observe the Results
- Save the VI as XY_Graph_Sin_Cos.vi
|