TEMPERATURE ANALYSIS TUTORIAL
INTRODUCTION
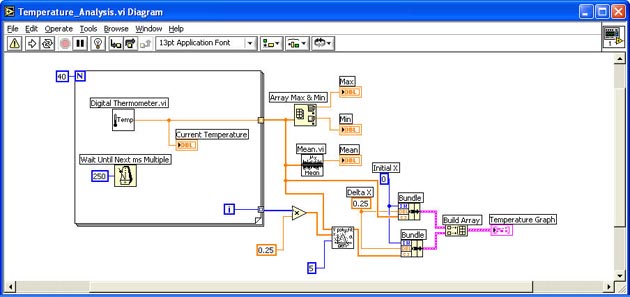
In this exercise, you will create a VI that measures simulated temperature data every 0.25 seconds for 10 seconds and display it in real time on a Waveform Chart. After the data acquisition is complete, the VI will plot the temperature data on a multiple-plot Waveform Graph along with the best-fit temperature. The VI will also calculate the maximum, minimum and average temperatures acquired during the 10-second data acquisition time and display the results on three digital indicators.
The For Loop has 40 iterations and stores the temperature measurements in an array created (indexed) at the array boundary. When the For Loop is complete, the array passes to the Array Max & Min function and the Mean VI, and then the results are passed on to the three Digital Indicators. The VI also bundles both the temperature array data and the best-fit data in order to control the Initial X and Delta X values of each. Finally the Build Array function prepares and combines both of those array data for the multi-plot Temperature Graph.
Create the block diagram shown above. Make sure and set the X scale on the Waveform Chart as shown and set the Y scale to Automatic on both the Waveform Chart and the Waveform Graph. Also, make sure that the plot legends are labeled correctly and adjusted as necessary to display multiple plots.
There are some functions you may have not seen. They are explained below.
 |
Digital Thermometer VI is a Sub VI which gives simulated temperature readings.
Pop-up > Tutorial > Digital Thermometer VI
|
 |
Wait Until Next ms Multiple function is similar to the Wait (ms) function, but is better for making loops execute at specific intervals and synchronizing activities. In this case it is causing the loop to iterate every 0.25 seconds.
Pop-up > Time & Dialogue > Wait Until Next ms Multiple |
 |
Array Max & Min function gives the maximum and minimum temperature measured during the acquisition time.
Pop-up > Array > Array Max & Min
Make sure and wire to the correct connector hot spots:
 |
 |
Mean VI is a sub VI that gives the average of the temperature measurements.
Pop-up > Mathematics > Probability & Statistics > Mean VI
Make sure and wire to the correct connector hot spots:
 |
 |
Bundle function assembles plot components into a single cluster and, in this case, control the Initial X and Delta X values. Pop-up > Cluster > Bundle |
 |
General Polynomial Fit VI gives an array that is a polynomial fit to the temperature array. The Sub VI determines the best fit for the points in the temperature array. This exercise uses five as the polynomial order.
Pop-up > Mathematics > Curve Fitting > General Polynomial Fit VI
Make sure and wire to the correct connector hot spots:
:  |
 |
Build Array function crates an array of clusters from the temperature cluster and best fit cluster.
Pop-up > Array > Build Array |
|