SINE COSINE INDICATOR TUTORIAL
INTRODUCTION
In this tutorial, you will
- Start a New VI and Save It
- Create the VI
- Add a Bundle Function Between the Sine and Cosine Indicators and the Waveform Chart
- Run the VI and Observe the Results
- Save the VI and Exit Labview
START A NEW VI AND SAVE IT
Run Labview and Start a new VI and save it as Sine_Cosine_Indicator.vi
Tile the windows Up and Down
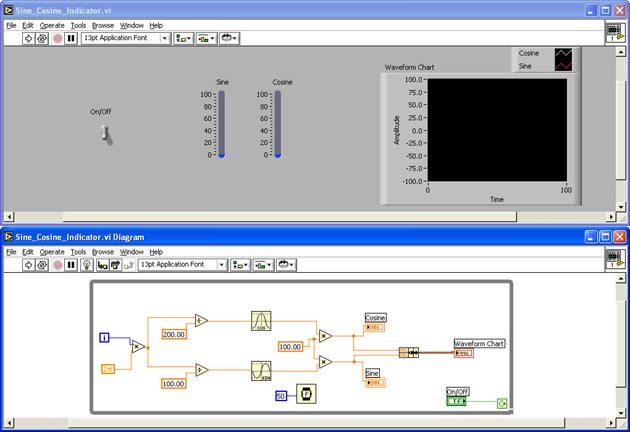
CREATE THE VI TO THIS POINT
Create the Front Panel and Block Diagram to the point shown below:
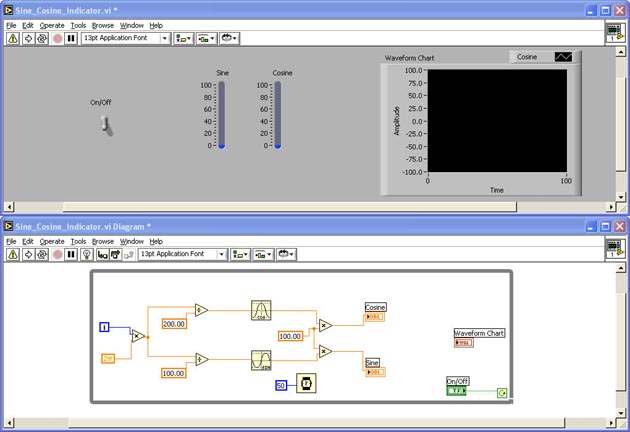
The Sine and Cosine functions are found in the Numeric > Trigonometric menu
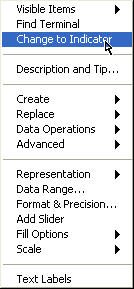
Use Controls > Numeric > Vertical Fill Slides for the Sine and Cosine indicators and change them to indicators by right-clicking on them and selecting Change to Indicator
Set the scales on the Sine and Cosine Indicators to the proper scale as shown.
Set the Y-Axis Scale on the Waveform Chart to the proper scale as shown.
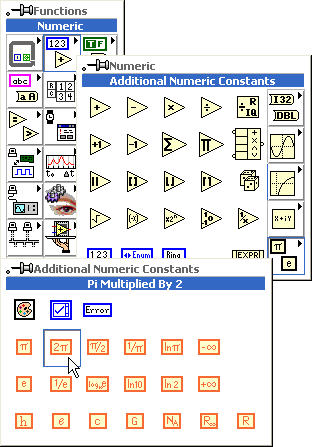
Wire the inputs of the Multiply function on the left to the the Iteration Terminal of the While Loop and to the Pi Multiplied by 2 constant:
Functions > Numeric > Additional Numeric Constants > Pi Multiplied by 2.
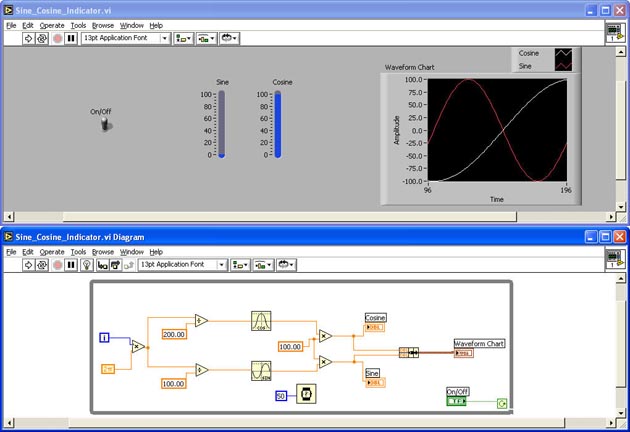
ADD A BUNDLE FUNCTION BETWEEN THE SINE AND COSINE INDICATORS AND THE WAVEFORM CHART
Add a Bundle function between the Sine and Cosine indicators and the Waveform Chart indicator:
Functions > Cluster > Bundle
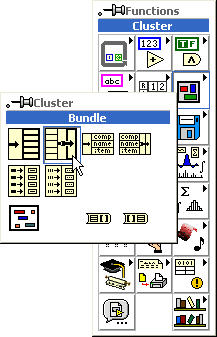
Wire the input of the Bundle function to the inputs of the Sine and Cosine indicators (create a wire junction for each)
Add a second plot to the the Waveform Chart by dragging the plot indicator up to show the second plot
Your Front Panel and Block Diagram should look like this:
RUN THE VI AND OBSERVE THE RESULTS
Switch the On/Off switch to on the run the VI.
Your Front Panel Should look liike this:
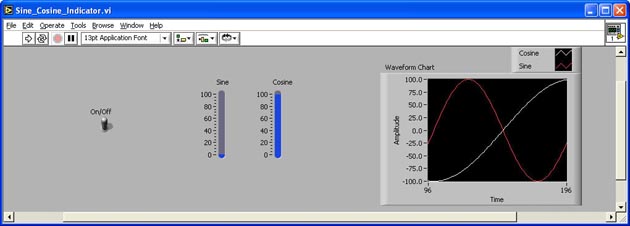
Stop the VI with the ON/Off switch.
SAVE THE VI AND EXIT LABVIEW
|