HomeModulesModule 1.6 (Labview Graph Indicators) → Tutorial 1

SINE COSINE GRAPH TUTORIAL


INTRODUCTION

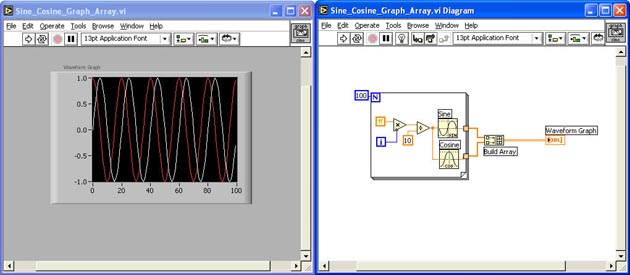
In this simple exercise, you will create a VI that will create a VI that displays a Sine and Cosine array data on a Waveform Graph.

  • Start a new VI
  • Place a Waveform Graph on the Front Panel
  • Place a For Loop on the Block Diagram and program it for 100 iterations
  • Add the Sine and Cosine functions inside the loop

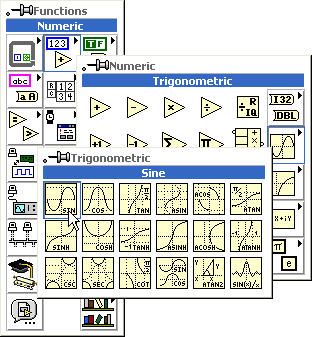
    Pop up in the Block Diagram > Numeric > Trigonometric > Sine/Cos

  • Add the Numeric Multiply and Divide functions to the Block Diagram
  • Add a Numeric Constant to the Multiply and Divide functions
  • Add the Pi constant to the Multiply function
    • Pop up in the Block Diagram > Numeric > Additional Numeric Constants > Pi

  • Add a Bundle function to the Block Diagram outside the loop
  • Wire as shown
  • Run the VI and observe the results
  • Save the VI as XY_Graph_Sin_Cos.vi