HomeModules Module 1.6 (LabView Graph Indicators) Connect
I ntroduce
C onnect
A pply
R eflect
E xtend

Connect - LabView
Graph Indicators

Graph Indicators

Graph Indicators

Definition

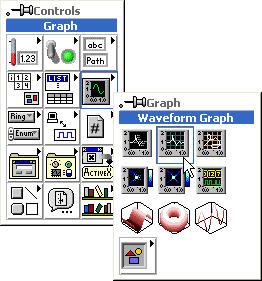
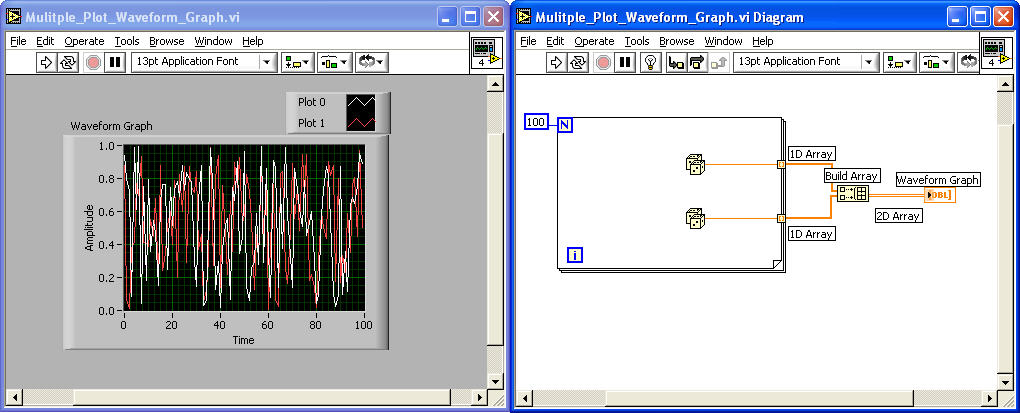
Graph indicators are 2D displays of one or more data arrays in what are called plots. There are two types of graphs: Waveform Graphs and XY Graphs. Their Front Panel display looks the same, but they are functionally very different.

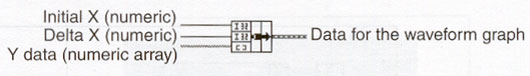
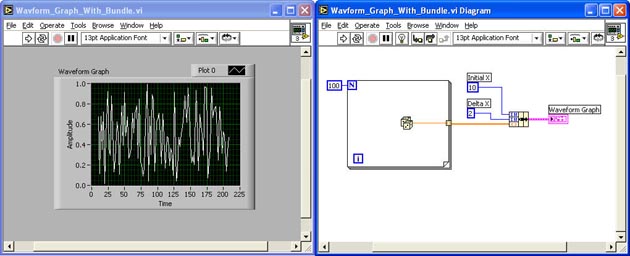
Both graphs often utilize Cluster data structures to control the incoming data display, so the Bundle function is frequently used. For Waveform Graphs, the bundled components include the initial X value, the delta X value (increment or spacing between X values), and the Y array data.


Waveform Graphs

Direct-Wired Single-Plot Waveform Graphs

Basic single-plot graphs can skip the Bundle function and pass Y array values to the graph. Without the bundle function, the default values are Zero and One for the X and Delta X values respectively. Below is an example of a single-plot waveform graph that has the output 1D array of random numbers wired directly to the waveform graph. Notice that the initial X value is zero and that delta X is 1:


Single-Plot Waveform Graphs Using the Bundle Function

Below is an example of a single-plot waveform graph displaying a 1D array of random numbers. This time the output is wired through a bundle function with numeric constants setting the Initial X to 10 and the Delta X to 2. Notice that the graph starts at 10 on the X axis and that the increment spacing is twice as wide (the X axis range is between 10 and 210).


Multiple-Plot Waveform Graphs

You can create a multiple-plot waveform graph of two 1D arrays by combining the arrays with a Build Array function which creates a 2D array. Below is an example. Notice that because the 2D array is directly wired to the waveform graph, the Initial X is zero and Delta X is 1. Bundle functions could be inserted between the loop output and the Build Array function to control the graph display.

.


Creating a Waveform Graph

To create a Waveform Graph, pop-up on the Front Panel > Controls > Graph > Waveform Graph


XY Graphs

Definition

The XY Graph Indicator is a Cartesian graphing indicator used to plot multi-valued functions like circular shapes, mathematical functions or waveforms with varying time bases. Waveform graphs are designed to plot evenly-sampled waveforms. XY Graphs specify actual points using their (X,Y) coordinates. The XY graph expects an input of bundled X and Y arrays. Below is an example of an XY graph displaying a one-cycle Sine array versus one-cycle Cosine array on an XY graph, which produces a circle.


Creating an XY Graph

To create an XY Graph, pop-up on the Front Panel > Controls > Graph > XY Graph


Click here to move on to the next section (Apply).