Align and Distribute Objects Rings
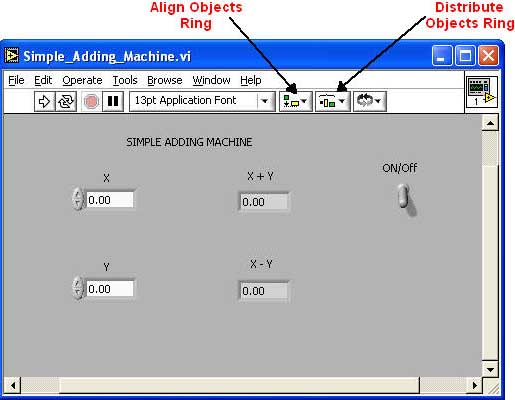
You can use the the Align and Distribute Objects Rings to quickly and easily make the objects on your Front Panel or Block Diagram nice and neat. The ring menus are at the top of both the Front Panel and Block Diagram Windows:
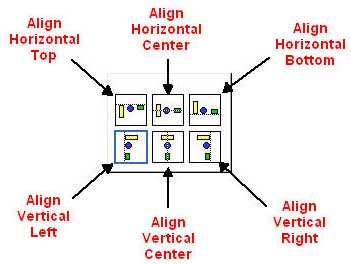
The Align Objects Ring
The Align Objects Ring has options for aligning nodes both horizontally and vertically.
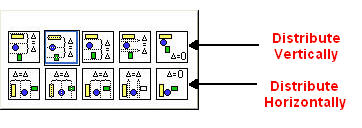
The Distribute Objects Ring
The Distribute Objects Ring has many options for evenly spacing nodes:
Here is a quick example of how they can be used together. The nodes are being selected by dragging a selection window around them:
Data Types and Their Wire Types
Data Types
There are three overall possible data types in a VI
- Number- This data type contains numbers that can be either floating point or integer.
- Boolean - This data type contains logical combinations of TRUE/FALSE, AND, OR, NOT, Etc.
- String - Contains alpha-numeric characters only
All of these data types can be in either Scalar, 1D Array or 2D Array form. Arrays will be covered in a later module.
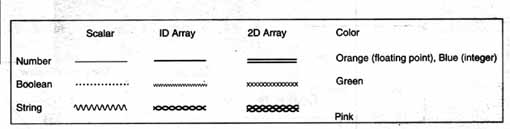
Wire Types
There are different wire colors and types that depict what kind of data is flowing through a particular wire and if it is in Scalar, 1D Array or 2D Array form:
Numeric Control Representation
Numeric control and indicator terminals can appear differently on the block diagram due to how their Representation is set. These representation settings provide different methods of storing data and aid in effective memory use. The different numeric representations utilize different numbers of bytes in memory, and can be interpreted as being signed or unsigned. The colors also convey information; Blue denotes integer data, and orange is for floating-point data. The default for most controls and indicators is DBL (Short for double precision) which has an 8 bit size. The following table shows all representations with the most commonly used in bold.
Numeric Control and Indicator Representations
| Representation |
Abbreviation |
Terminal |
Size (bytes) |
| byte |
I8 |
|
1 |
| unsigned byte |
U8 |
|
1 |
| word |
I16 |
|
2 |
| unsigned word |
U16 |
|
2 |
| long |
I32 |
|
4 |
| unsigned long |
U32 |
|
4 |
| single precision |
SGL |
|
4 |
| double precision |
DBL |
|
8 |
| extend precision |
EXT |
|
16 |
| complex single |
CSG |
|
8 |
| complex double |
CDB |
|
16 |
| complex extended |
CXT |
|
32 |
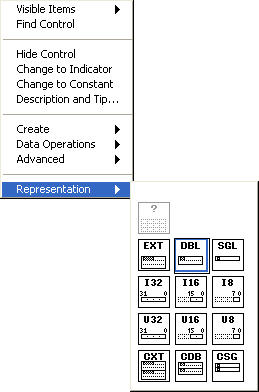
Changing Representations
To change the representation on a numeric control or indicator, pop-up on it in either the Front Panel or the Block Diagram > Representations > Choose the desired representation:
Labview Help
Context Help
Labview has a very comprehensive Help system. The most common way to use the Help system through Context Help Windows. To access a Context Help Window:
- Select Help (Pulldown) > Show Context Help
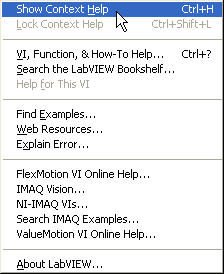
- Bring the cursor over a Block Diagram Component
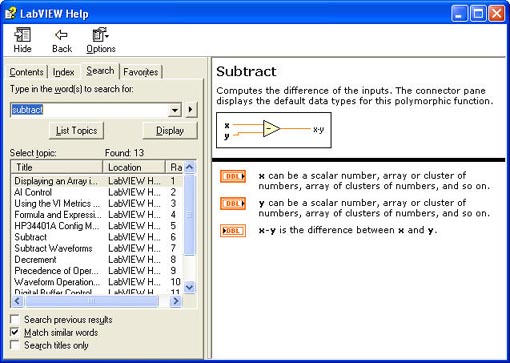
A Context Help Window should appear giving a brief description of the component you have selected:
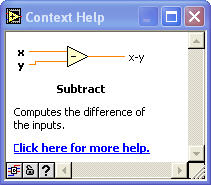
Accessing Help through Context Help
If more information is needed, click on the "Click here for more help" link in the window. This will take you to the complete Help Page for the selected component:
Accessing Help Directly
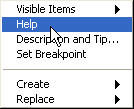
You can also pop-up on any node > help to go directly to the help menu showing the item.
Debugging VIs
Besides clicking on the Broken Run icon and reading the list of errors, there are some debugging tools on the Block Diagram and on the Tools Palette to help you figure out what is wrong with your VI.
Debugging Tools on the Block Diagram
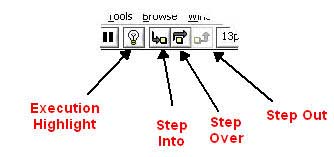
Execution Highlight
 The Execution Highlight button, when pressed, turns bright The Execution Highlight button, when pressed, turns bright  and allows you to view the data flow through the Block Diagram slowly as it goes from one Block Diagram component to the next. and allows you to view the data flow through the Block Diagram slowly as it goes from one Block Diagram component to the next.
Step Over
 The Step Over button activates the single-step mode which steps the execution of the VI from node to node. Each node blinks then it executes one at a time. The Step Over button activates the single-step mode which steps the execution of the VI from node to node. Each node blinks then it executes one at a time.
Step Into
 The Step Into button activates the single-step mode and is used to step into a loop or Sub VI so you can single step inside them. The Step Into button activates the single-step mode and is used to step into a loop or Sub VI so you can single step inside them.
Step Out
 The Step Out button is used to step out of a loop or Sub VI and to end the execution of a VI. The Step Out button is used to step out of a loop or Sub VI and to end the execution of a VI.
Debugging Tools on the Tools Palette
The Tools Palette contains two debugging tools, the Breakpoint and Probe tools:
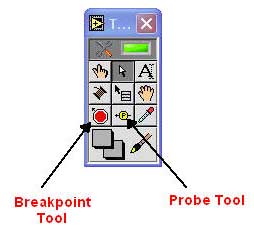
Breakpoint Tool
 The Breakpoint tool is used to set breakpoints or stopping points in a VI, especially in a Sub VIs, functions, structures and wires. The Breakpoint tool is used to set breakpoints or stopping points in a VI, especially in a Sub VIs, functions, structures and wires.
Probe Tool
 The Probe tool creates probes on wires in the Block Diagram. These show you the data at that point in a wire at a particular time. It is used for checking intermediate data inside a VI. The Probe tool creates probes on wires in the Block Diagram. These show you the data at that point in a wire at a particular time. It is used for checking intermediate data inside a VI.
Click here to move on to the next section (Apply). |