Visualization Of Scientific Data


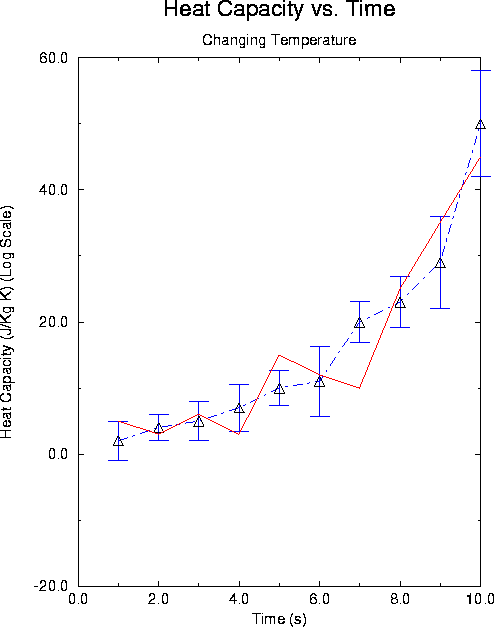
Examples and sample outputs which demonstrate easy ways to visualize data on workstations and PC's. All of the programs used are available as shareware or freeware at indicated sites. (Part of NACSE research at Physics.)

Xmgr (ACE/gr). It is our preferred 2D plotting program, producing
publication quality output with a
menu-driven interface, dealing easily with Greek symbols and error bars, and given away freely!

gnuplot
and PlotMTV. (If Xmgr could produce 3D plots, we would prefer it.)
mpeg's) movies for viewing and locations for you
to pick up movie players.
 Mail
to Jon Maestri (author).