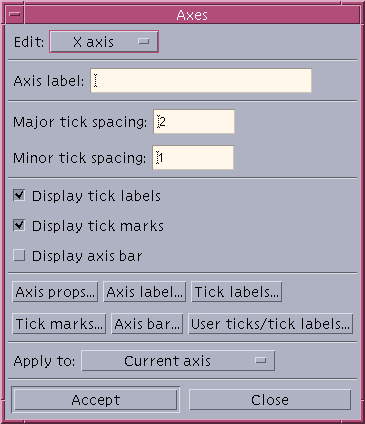
Most of the basic utilities are in the Graph menu. To label the axis, select the Tick labels/tick marks... item from the Graph menu. A window will appear that looks like this:
To label the x-axis, click in the box next to Axis label and type in whatever you would like to call it. Then click on Accept at the bottom of the window. Now click on the box that is labeled X axis. A pull down menu will appear, click on the line that saysY axis. Again click on the box next to Axis label and type in what you would like to call it.
You can place the minor and major ticks at a spacing of your choice by inserting the numbers of your choice in the boxes labeled Major tick spacing and Minor tick spacing.
There are many other options available that I will not go into, I will let the reader explore these options.
Select the Titles... item from the Graph menu. A window will appear, and you just have to insert your title and/or subtitle in the appropriate box. To change the font click on the Props... button, you will see various options you can use.
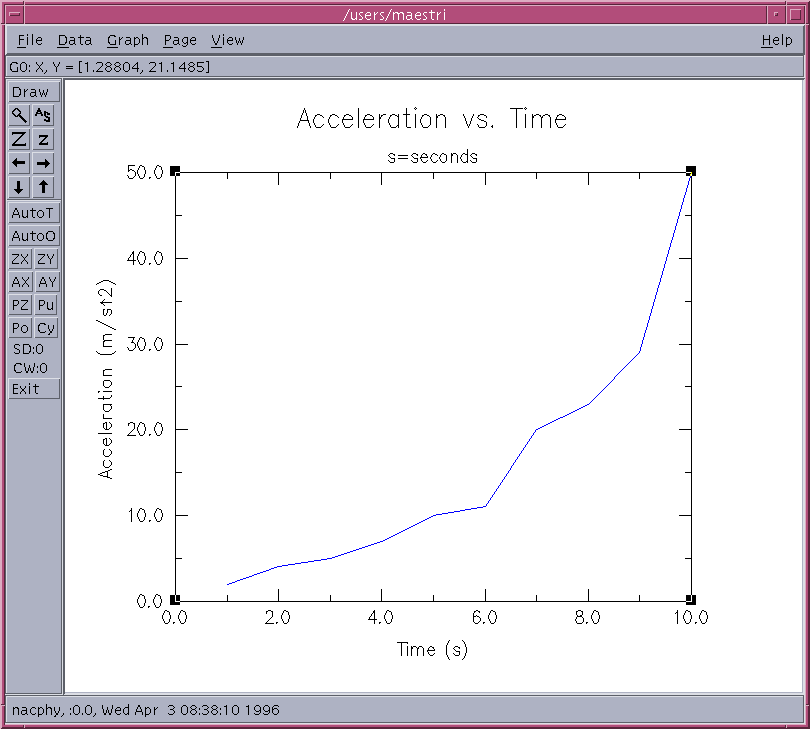
Now you should have a plot that looks something like:
Now I will talk about changing the symbols used to create your plot. Xmgr has a large variety of symbols to use. Select the Symbols... item from the Graph menu. Here is what the symbols menu looks like:
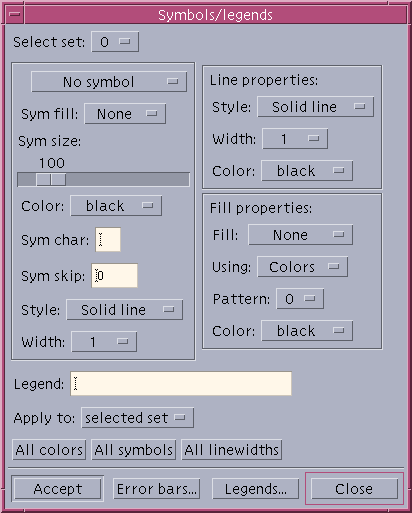
It is very important to keep track of the Select set: submenu if you have multiple plots on a single graph. This menu allows you to change line properties from a normal line to dotted, dashed, colored or no line at all. You can also change the symbol used to represent your data point. I will let the reader experiment with this window and will not explain any further.