There are several ways to open xmgr. You can open the progam or you can open it and specify a data file to plot. I will explain both of these options. Using the first method, you can open xmgr by giving the command xmgr. Go ahead and give the command!
/users/research/maestri/TUTOR::daphy> xmgr
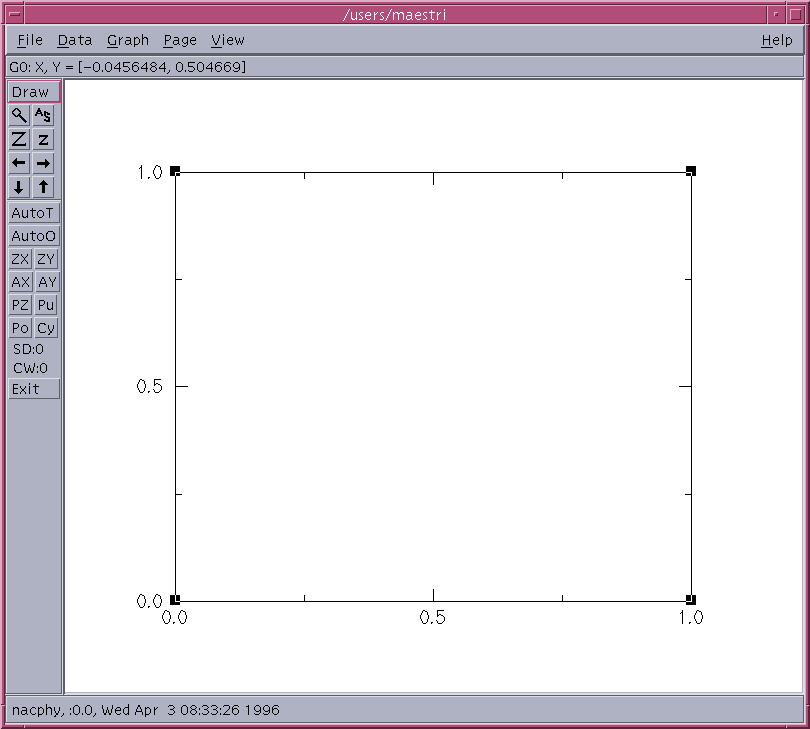
A window containing a blank graph, some icons, and some menu's will appear. It should look something like this picture:
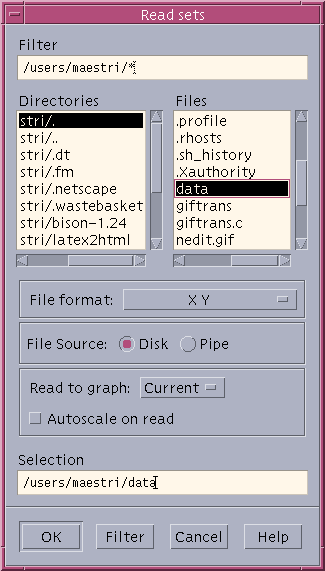
To plot the data in your data file, you must first open the File menu of xmgr and select Read sets....
 You will
see a number of options on the Read sets... menu. First
select the file data from the list of files, it will become highlighted. Next I would
recommend clicking on the Autoscale on read button, you
can always change the scale later if you want. The File
format button is very important. It won't matter for us right now
because the default setting is setup for our file format. This submenu has
to be changed if you would like to plot multiple plots on singe graph, use
error bars, etc...
You will
see a number of options on the Read sets... menu. First
select the file data from the list of files, it will become highlighted. Next I would
recommend clicking on the Autoscale on read button, you
can always change the scale later if you want. The File
format button is very important. It won't matter for us right now
because the default setting is setup for our file format. This submenu has
to be changed if you would like to plot multiple plots on singe graph, use
error bars, etc...
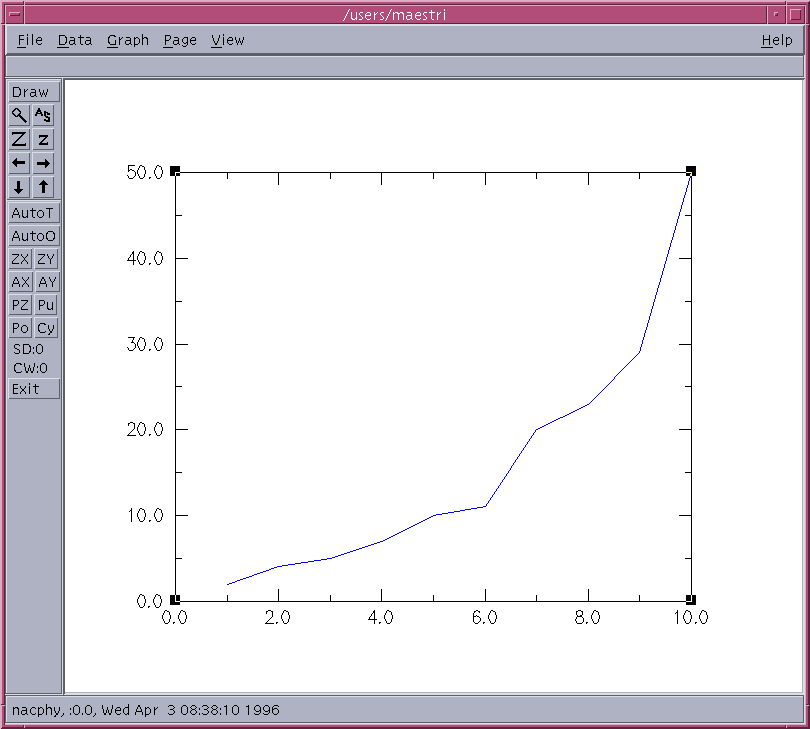
Click ok and the data will appear on the plot as a line. The plot should look like the figure below:
Now you are ready to use some of the plot utilites to add the finishing touches to the graph.