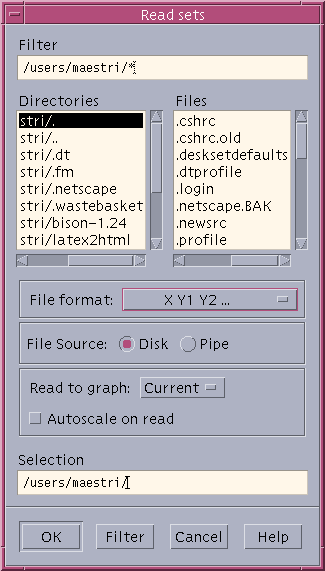
Multiplot Graphs
Multiplot graphs share the x-axis so the data must be in a format similar to below:
1 2 3
4 5 6
7 8 9
10 11 12
where the first column contains the x-axis values and the next two columns are the two y-axis values. You will first need to create the proper data file then select the proper