 The purpose of this
page is to provide an introduction to the Xmgr graphing
program. It is not meant to be a stand alone reference guide, other sources
should be consulted for more information. This page is an interactive tutorial
designed to show you the basics of xmgr. You will be guided step by step
through some of the graphing procedures. All of the sample graphs will be
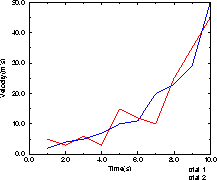
displayed initially using thumbnail figures. If you would like a close up view,
just click on the figure. To return to where you were, click on the "back"
button at the upper left corner of the netscape window.
Xmgr is a plotting
program that provides a wide range of functions such as multiple line plots,
color plots, some data analysis tools, multiple axis
options and others. This is a xwindow menu driven program which makes finding
unknown commands easier.
The first step in creating a graph is to have some data. There are several ways to create data, and I will describe two. You will need to create a text file using your favorite text editor such as vi, emacs, or nedit. If you are generating data from a program it is generally easist to port the data directly into a file when you execute the program.