The format of the data is very important. The data must be broken up into columns where the first column consists of the values to be plotted on the ordinate and the second column consists of the values to be plotted on the absissa. Here is an example of what the data should look like:
1 2
2 4
3 5
4 7
5 10
6 11
7 20
8 23
9 29
10 50
We will use this data to make an example graph.
I am going to use nedit during the tutorial, if you prefer another text editor an are experienced with it, just use you text editor in place of nedit. Open nedit using the command:
/users/research/maestri::goophy> nedit
A empty window will appear titled "Untitled".
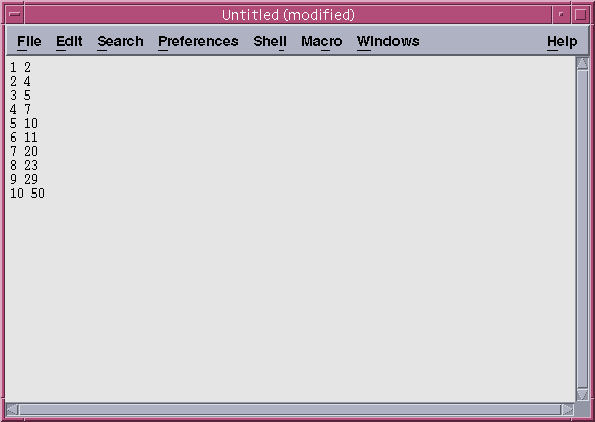
Now you will need to copy the sample data above into this window. You can do this by moving the mouse curser to the left of the first number(1). While holding the left mouse button down, move the cursor to the right side of the last number(50). All of the numbers you selected should now be highlighted. Go the the Edit menu of Netscape and click on copy. Move the mouse over to the empty nedit window and open the menu labeled Edit and select paste. the numbers should appear in the nedit window.
The window should now look something like this:

Save this document by selecting save out of the edit menu and save it as "data". Now you are ready to use xmgr.