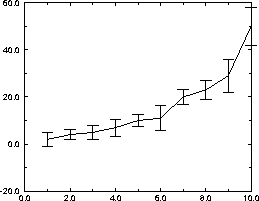
The first step in creating error bars is to create the data file. The format for the data file is shown in the Read sets... item in the File menu. Click on the submenu labeled XY, you will see a variety of file formats. The symbols DY and DX represent error values in the corresponding coordinates. So if you wanted a x-y plot with error in the y values, you would select X Y DY. Here is an example set of data:
1 2 3
2 4 2
3 5 3
4 7 3.6
5 10 2.6
6 11 5.3
7 20 3.1
8 23 3.9
9 29 7
10 50 8
Now you can follow the same procedure as in the Opening xmgr item in the tutorial front page and selecting the appropriate data set. By plotting the above data, your initial plot should look like this: