Visualizing Chaos With Sound
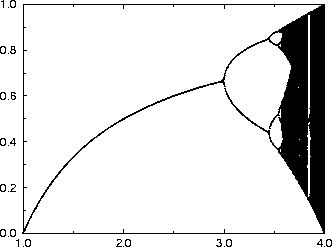
The bifurcation diagram of the logistic map given in the figure plots
the fixed population of bugs on the ordinate as a function of the
growth rate on the abscicca. In the dark regions, the system is chaotic.

The Logistics Map (210k)
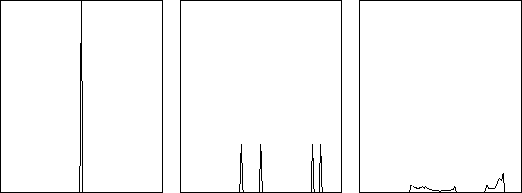
Instead of just plotting the fixed population of bugs, we now use a grid to
find out how often the population is in a given range. In the following plots
the x-axis represents the size of the population and the y-axis how often the
population had this value.

Slices of the bifurcation map for growth rate m=2.0, 3.2 and 3.6
To visualize the bifurcation map with sound, we create these plots for the
whole range of the growth parameter and interpret them as a fourier spectrum.
In other words, when there is only one population there will be just one
frequency played, yet the value of the frequency will increase as the
population increases. When there are two populations, there are two
frequencies played, and when there is chaos
many frequncies are played. In fact, there is at least some poetic
justice here since chaotic motion is the combination of many types of
periodic motions.
 Back to the sound page


 Back to the sound page