You are here: start » activities » main
The Heater Activity
Highlights of the activity
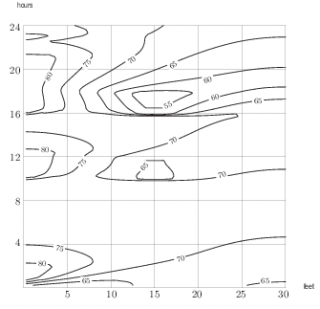
- This small group activity is designed to help students visualize functions of two variables using contour diagrams.
- Students work in small groups to analyze a contour diagram showing isotherms over time and space.
- The whole class wrap-up discussion emphasizes the use of contour diagrams to answer physical questions.
Reasons to spend class time on the activity
This activity will help students to interpret contour lines as functions of two variables and to make sense of physical significance of topographical maps.
Reflections
Instructor's Guide
Student Handouts
Authors: Adapted from Calculus, 4th edition, by Hughes Hallett et al, (c) 2005 by John Wiley & Sons, Inc; used by permission.
To edit this page, go here