Data Analysis
This section seeks to explore how student writing changed from the beginning of the process to the end of the process, and to identify which project implementations lead to these changes.
How Student Writing Changed
Quantitative Data Acquired with Rubric
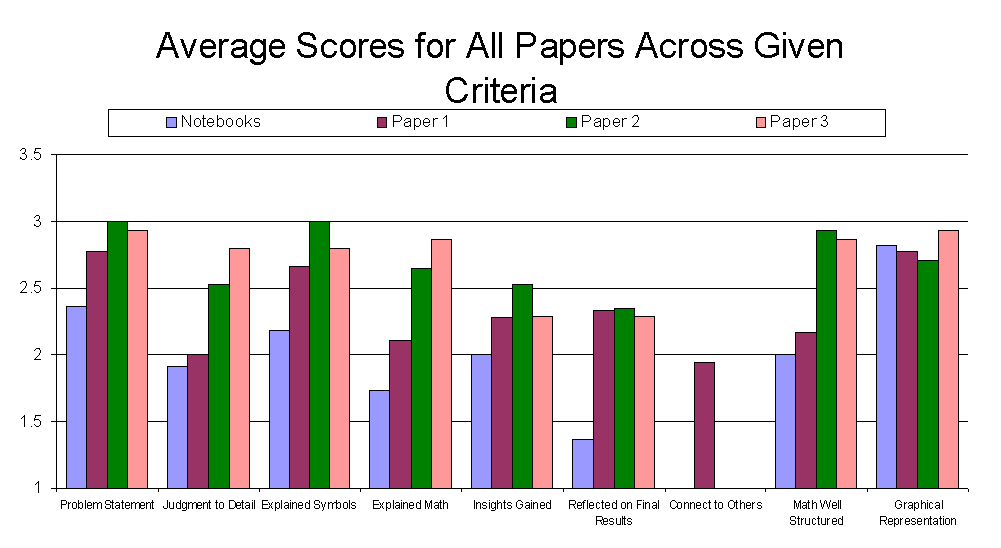
To measure how student writing changed throughout the process, each paper had been scored using the rubric. The graph below shows the average scores for a given rubric criteria across all three papers students produced. It also includes scores from notebook samples taken from the previous year of students. Note that a 3 is the highest possible average score for a given criteria.
It can be seen that there was substantial growth in most rubric criteria in comparison to the notebook writing samples from the previous year (with the exception of criteria 11). Note that the nature of criteria 9 made it impossible to score for most papers, only paper number 1 had relevant information to score in that criteria, and is thus only represented with one bar. In the cases of criteria 1, 3, and 8, most of the change in comparison to the previous year's samples came from the very first writing sample. This change could best be explained by the presence of the guiding questions, which may have bettered students' understanding of what they were expected to produce. Criteria 2, 4 and 10 showed marked improvement from the first writing sample to the final sample.
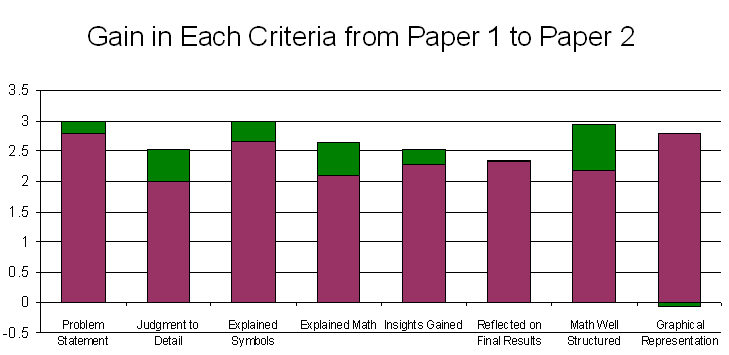
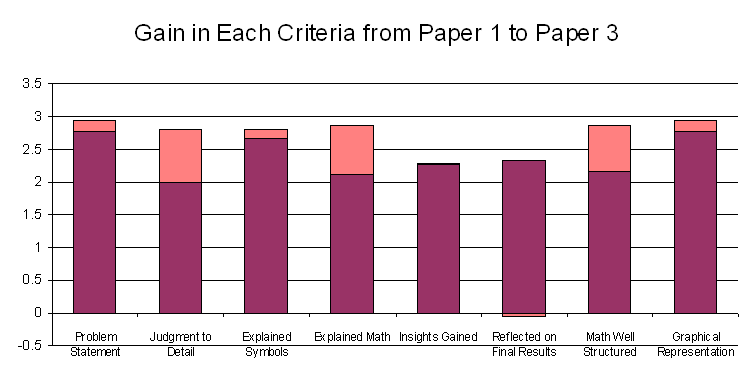
To measure how much improvement was made for each criteria, the change in averages of the scores from the first paper to the other papers were added to the average criteria scores of the first writing sample. The blue portion of a bar corresponds to the average class score for a given criteria, whereas the maroon portion represents the change. Note that if the two portions add to 3, the class as a whole improved the maximal amount. A portion of maroon in the negative direction reflects a net loss in the average score of a criteria.
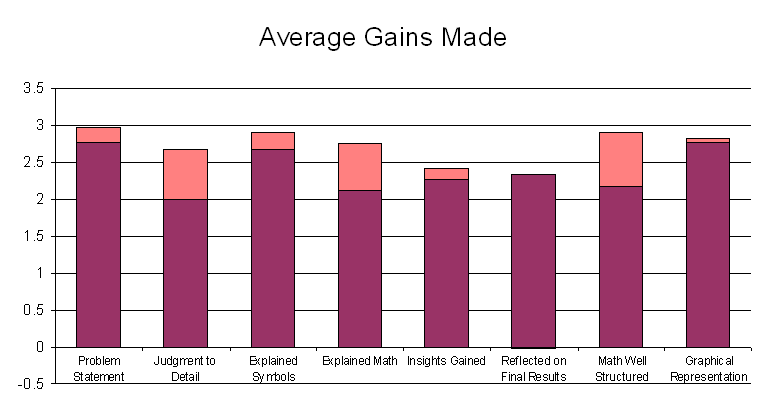
By taking the average of these changes, the following graph is obtained. It represents an average in the change from paper 1 to paper 2, and the change from paper 1 to paper 3. Because the 2nd and 3rd activities may have had conceptually more difficult material about which to write, an average of the two changes smooths out aberrations due to student misconceptions and poor understanding of the activity on which the writing was based. Note however that if there were improvement in a criteria from paper 2 to paper 3, this average will minimize the apparent overall gain in that criteria.
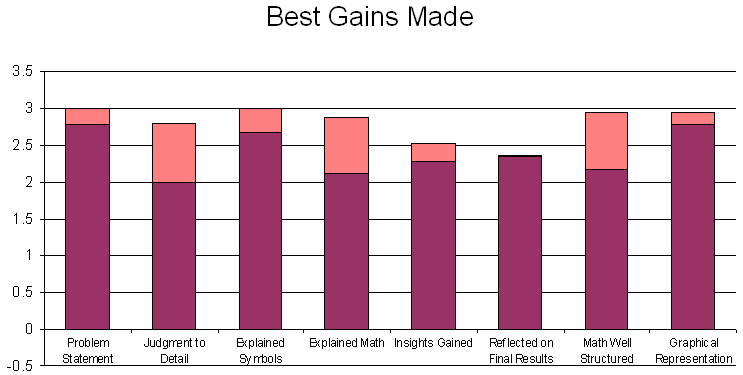
By giving students the benefit of the doubt and taking only the class' best gains, the following graph is obtained. This illustration may be useful if students were able to produce their best writing when they had better understanding of differing portions of the second and third activities.
By taking the average of all criteria scores for paper one per student and adding the average change in all criteria from paper 1 to paper 3 for each student, the following graph is obtained. This gives a good idea of how much each student changed individually, a score of three on this graph represents perfect scores across all rubric criteria. Once again, a maroon portion in the negative portion of the axis represents a net loss instead of net gain. 
Exemplar Papers
As can be seen in the graphs above, most students made gains in being able to address rubric criteria successfully. Observing the graph of Average Scores for All Papers Across Given Criteria shows that the largest gains were in criteria 2, 4, and 10, each of which directly involve how stylistically well written the paper is. There are many writing samples that show improvement in the overall structure of the paper and writing style. Included below are two papers from a student, the first and third writing samples produced.
Paper 3 - Magnetic Vector Potential
Note first the vast improvement in layout and formatting. This was a change unique to this student. There were other students who altered slightly the way they laid out sections and formatted their text, but only this student made any vast improvements. However, format changes aside, there were significant gains made in how well the content of the paper was structured.
Change in Professional Judgment to Detail
To observe the change in professional judgment, consider the following excerpts from the first paper:
In this problem we're dealing with electrostatic potential. It should be brought to attention before going into the problem that electrostatic potential is a scalar quantity and not a vector quantity.
The author never clearly describes why it is important to consider this detail, and its inclusion does not benefit the reader's understanding of the problem or its intricacies.
The length r is found by a simple application of the Pythagorean theorem which states that for any right triangle a^2 + b^2 = c^2 where a and b are the opposite and adjacent sides of the triangle respectively and c is the hypotenuse.
It would have sufficed to have simply stated that r was obtained using the Pythagorean theorem; the application of the theorem is important to the reader, but the theorem itself will already be obvious.
The final writing sample produced by the student shows a marked improvement in professional judgment on how much detail to include in the write-up. Not only did the author exclude extraneous information like in the excerpts above, but the paper was also much more meticulous in describing every motivation of each step in the solution.
Change in Explanations of Mathematical Manipulations
The explanation of mathematical manipulations were much better presented in the third paper. Consider the following excerpts taken directly after a mathematical manipulation in the first paper:
Simply factor out a D^2 out of the denominator to obtain
Next, separate the constants from the variables
In addition to separation of constants, take the denominator and change it to the numerator by making the power negative
Compare them to the following excerpts from the final paper:
Since we already know how to find the current I in terms of λ and v we can now simply plug in our values for λ and v to derive an equation for the current in the ring.
Looking at figure 1 again, we need to find vector equations for the r and r0 vectors. We know that at all points along the r0 vector the z0 component is equal to zero. Thus the general equations for the two vectors in space are below
In the mathematical steps from the final writing sample, each mathematical manipulation was motivated and justified. In the first paper the math that had been carried out was simply described in words. In this way, the writer improved significantly at describing the tricky math behind solving the problem.
Change in the Structuring of the Mathematics
For this student, there were mathematical manipulations carried out within the text of the solution. However, there are multiple pages of disassociated mathematics attached at the end of the paper. In the first writing sample produced, students often included mathematical procedures completely separately from the rest of the solution in this fashion. The math of the problem was often sandwiched in between the introduction on the conclusion, or attached to the end with a reference somewhere in the paper reading “see attached calculations.” In the final paper produced by this student, the math seems like a part of the solution to the physics, rather than a disembodied section of its own.
Other Changes
There is a lack of an “outline” section in the final paper that was present in the first. Outlining problem solving methods is an important part of successfully answering a question in physics, but it does not serve a purpose in the write-up of the solution itself. There were a significant amount of students who included such information which detracted from the purpose of the write-up in their first writing sample, but had removed such sections by their final write-up.
There was nearly a complete lack of analysis on the author's part in the first paper (save a few diagrams with short explanations on the last few pages) on what their answer told about the physics and nothing on what they had gained in solving the problem. In the final paper, however, there were paragraphs dedicated to analysis of the problem. This change was not typical in most students, as most students did not show evidence for change in their ability to analyze what the solution physically meant.
Student Reflections
There was a general consensus amongst students that improvements in their ability to write occurred primarily in their organization, attention to detail, and their ability to explain mathematical explanations. These three student-made observations correspond strongly with rubric criteria 2 and 4, which showed the most change using the quantitative data derived from the rubric. An interesting point to note is that even with the generality of the prompt (given in the Methodology Section) there was still fairly widespread consensus amongst the students as to how writing had improved. The fact that the prompt did not ask for them to identify specific changes through use of a survey of questions addressing each of the rubric criteria allowed students to reflect on any part of the process and how, in general, their writing had improved. Many of the students relied on the rubric criteria to identify change in their writing, but others did not.
