Radial Wavefunctions
Highlights of the activity
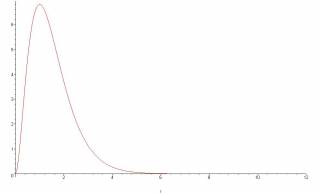
- This computer visualization activity is designed to help students visualize the radial probability density of the hydrogen atom $R_{n,\ell}$ for different values of $n$ and $\ell$.
- Students use a Maple worksheet or Mathematica notebook to plot Laguerre polynomials to observe radially dependent wavefunctions of the hydrogen atom and visualize the corresponding probability densities.
- The whole class wrap-up discussion connects the radial probability density visualizations with students' foreknowledge of hydrogen orbitals from chemistry.
Reasons to spend class time on the activity
We find that many students have difficulty understanding the role of special functions in physics. The Maple worksheet provides plots of Laguerre polynomials, the radial probability density, and the probability density of finding the electron in a spherical shell. It is hoped that being able to visualize these probability densities will help students connect their knowledge of the hydrogen orbitals from their chemistry courses to their new knowledge of quantum mechanics.
Reflections
Instructor's Guide
Maple Worksheet
cfradialwavefunc.mw (Maple 13)
cfradialwavefunc.mws (Maple 11 Classic)
