You are here: start » activities » main
Visualization of the Spherical Harmonics
Highlights of the activity
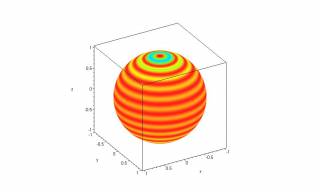
- This computer visualization activity is designed to help students visualize single spherical harmonics.
- Students use a Maple worksheet or Mathematica notebook to calculate the probability density corresponding to single spherical harmonics.
- The entire class wrap-up discussion addresses how to represent the probability densities computed from spherical harmonics in a variety of ways.
Reasons to spend class time on the activity
We find that many students have difficulty understanding the role of special functions in physics. The Maple worksheet provides different (equivalent) representations of probability densities computed from spherical harmonics. Being able to use all representations and understand their equivalence is a landmark on the students' path to becoming professional physicists. To address the important issues of stationary states and time-dependent states, students are later asked to animate these plots as a function of time, for the case where the different angular momentum eigenstates have different energies.
Reflections
Instructor's Guide
Maple Worksheet
cfqmsphere.mw (Maple 13)
cfqmsphere.mws (Maple 11 Classic)
