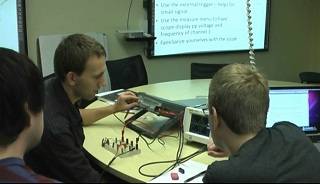
LRC Lab: Harmonic Driver
Highlights of the activity
- This integrated laboratory activity is designed to help upper-division undergraduate students to investigate the single frequency response to the simplest driving force, to have hands-on experience with real electronic components and measuring devices, and to have a chance to synthesize in a write up.
- Students were to measure the current response of the series LRC circuit to a sinusoidal voltage input at a series of frequencies about resonance frequency, To determine the complex admittance of the LRC circuit as a function of frequency, in amplitude/phase form, To estimate the quality factor $Q$ and the resonance frequency $\omega_1$ from admittance data, and to compare the experimental result to the model discussed in class.
- The whole class discussion focus around issues of measurement and how to write a good lab report.
Reasons to spend class time on the activity
The series LRC circuit is an example of a damped, simple harmonic oscillator and the damping is accurately exponential. It is easy to apply a single-frequency sinusoidal voltage and to observe the response. The experimental set up is left out all through the course for the students to play with - and they do. They come back to test ideas related to superposition, and the difference in the charge and current responses, for example.
The hands-on experience with real electronic components and measuring devices cements the ideas. Students must physically select a sinusoidal voltage and measure its frequency, and carefully observe the frequency, amplitude and phase shift of the response (in our implementation, “response” is the current in the circuit with voltage across the resistor as proxy for the current). When asked beforehand, some students are not sure that the current will have the same frequency as the driving force. Most predict some sort of resonant response, but are unsure about magnitudes, how to measure and so on. Very few can predict or explain the phase shift, or easily relate the measured time shift to a radian shift.
This concrete example is a useful prompt many times in later discussions about harmonic systems: The instructor might ask, “Tell the class what happened in the LRC lab when you changed the frequency of the driving voltage?” Students may ask, “How does the response plot I made in the LRC lab translate to what we're doing in this pendulum example?” Remembering a physical activity is much easier than remembering a discussion.
We use this activity as a chance to for students to synthesize what they've learned in a coherent write up. There is a very clear distinction between the “measurements” and the “interpretation”, so the lab write-up can be broken into different sections, if necessary.
