Directions for HyperChem Modeling Program
Experimental Chemistry II, CH 463
The PC's in GBAD 311 and one in the SAACS room have the HyperChem ver 5.01, program
setup. The following directions are intended to get you started - for advanced applications
consult the Help menus and the manuals in GBAD 311 (or consult with Dr. Pastorek.) The topics covered in this handout are:
construction of a molecular structure, geometric optimization for the structure,
generation of the infrared and electronic spectra, orbital rendering and animation of the vibrational modes, and generating colored isosurface maps. HyperChem is a Windows program,
so it is easy to learn how to do things by just trying something: when all else
fails...there is on-line help!
Table of Contents
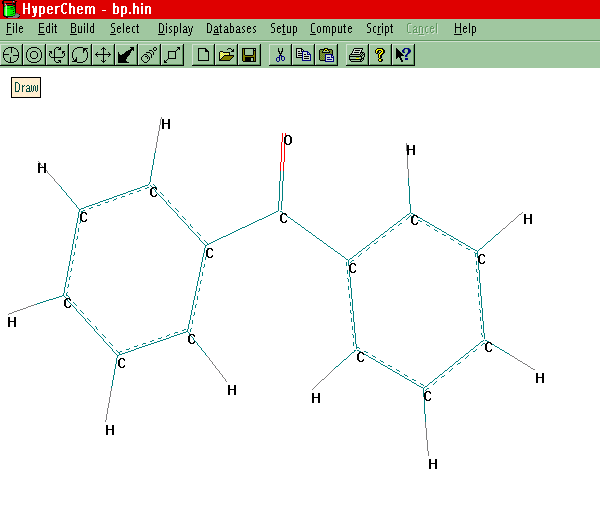
Sketch a Molecular Skeleton
- Select the X-Y rotation tool from the
tool bar. (This gets you out of the drawing mode).
- On the Top Menu Bar, select Build - Add Hydrogens
(if hydrogens are needed). Next go to Build - Model Build to generate the standard
3-D structure of the molecule based on standard bond lengths and angles. The structure you
have sketched out on the screen will be automatically updated. If you are happy with this
structure, Save it to a File. The structure file is saved with the .HIN
extension that only HyperChem reads. Other formats are available,
e.g., pdb (protein data base.)
Select
Tool
- The Select tool is the second tool from the left.
The Select tool is used to perform some operation on one of several molecules on
the screen or one part of a molecule. Use the select tool, for
example, to set desired angle and bond length constrains before building, for selecting
angles and bonds to be listed out in the dialog box at the bottom of the screen. Some
examples follow.
Click and drag over an angle in the molecular framework to readout the bond
angle value on the bottom dialog box.
Set Select - Molecules from the top menu, then click on the
molecule that you want to rotate relative to another molecule, pick the X-Y rotation tool with the left mouse
button as usual but use the RIGHT mouse button to move only the
selected molecule.
The Click-Draw technique is another useful
shortcut. This is an easy way to change the stereochemistry of a group about an atom. Pick
the Draw tool, and press and hold the Shift key while using the left mouse button
to click on the atom about which the flip should occur. Try changing
the position of the methyl group in methylcyclohexane from exo to endo using
this shortcut.
Printing
- Print is a choice under File. Pressing
the Print Screen key copies whatever is on the screen to the Windows Clipboard (also done
by pressing F9 key). This screen copy can be pasted into other Windows programs
(note: use this method if you are printing to the color deskjet in GBAD
311). The image
can also be sent to a file (see Setup Image in File-Preferences.)
- HyperChem will open and save as other structure file
formats including: PDB, ENT, MOL, SKC, CHM, ML2 and ZMT. Note:
to open protein data base (pdb) files, you have to rename the file as a .ENT
file. There are mucho examples of pdb files around the web.
Different Model Forms-Rendering
- Look under Display-Rendering to pick a structure
display format that you like (i.e., Ball and Stick, Spheres (space filling), etc.
The default rendering is usually Stick. Use this when performing
calculations (the program runs faster.)
- To change or set labels for the atoms in the
molecular structure, go to Display-Label. Display - Element
Color to change these if desired.
Calculations
Find the Geometrically Optimized Structure
Note: The program runs faster if the Display-Rendering is
set to Stick.
- Select Setup, SemiEmpirical, PM3 with no CI
(configuration interaction). This method is suggested to give the best model for
vibrational analysis.
- Select Compute, Geometric Optimization. After the
optimization is done, save the updated structure file (File, Save). The energy
gradient for the molecule has been minimized by slight changes in the geometry. If you
want to refine the optimization, or change the criteria, consult the manuals. To achieve a
global minimum in the molecular geometry, the calculated heat of formation should be the
lowest value possible (most negative value). You might try starting the optimization procedure from different
molecular geometries and checking the value for the heat of formation: the structure that
gives the lowest heat of formation is the best optimized structure. The heat of formation
is printed to the log file (see point below) after a single point calculation
and it is accessible from the main menu in HyperChem by selecting Compute,
Properties, Details next to Total Energy.
- Select File, Start a Log File (extension
.LOG) to output parameters of interest, e.g., Heat of formation, dipole moment, etc.
Consult the help or the manual for what value of PrintQuantumLevel to use to get the
parameters you want. After starting the Log File, run a single point calculation using the
geometrically optimized molecule. This will write the parameters of interest to the
log file. File- Close the log file and view the file with a text editor.
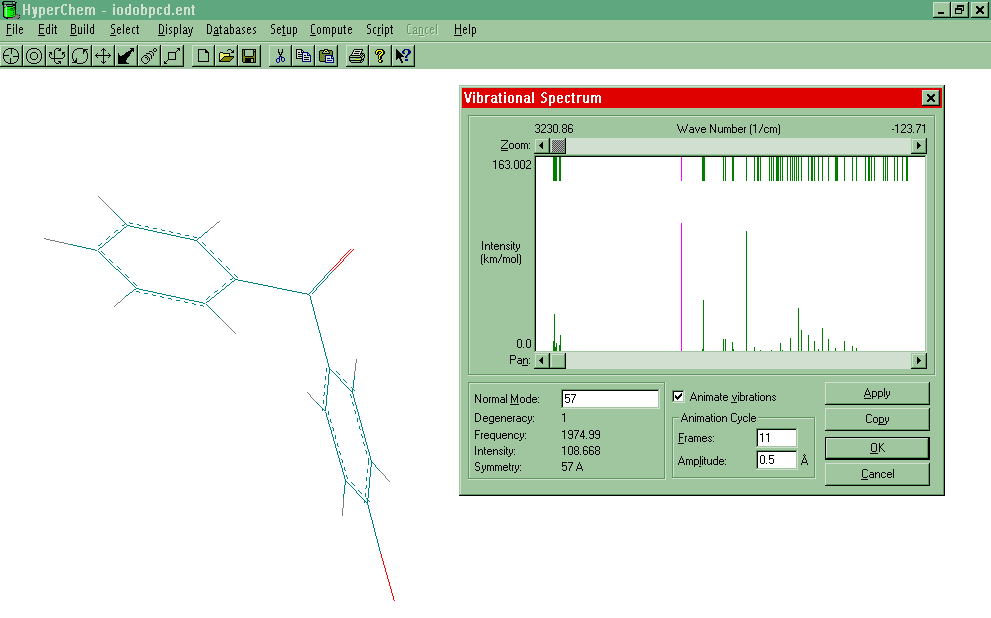
Calculate
and Animate the Vibrational Spectrum
- Select Compute-Vibrations. (Note: The actual
vibrational analysis can be slow for large molecules.)
- When the vibrational analysis is 100% done (look at the
dialog window at the bottom of the screen), save the .HIN file. Now Compute-Vibrational
Spectrum should now be active. Select it to show the stick model of the vibrational
modes.
- Use the Translational Tool to drag the molecule
off to one side of the screen. Select Compute- Vibrational Spectrum. Drag the
Vibrational Spectrum box to the other side of the screen. Highlight a vibrational mode by
pointing to it and L-clicking. The IR active modes are on the bottom of the spectrum, and
modes active in both the Raman and IR are on the top. Select Animate vibrations, Apply.
To see an example, click here.
- Saving the generated calculated vibrational
spectrum takes two steps. First, the IR.SCR macro needs to
be copied and stored on a local drive (edit the macro in any text editor). Second,
the IR.SCR macro is run after you have generated the vibrational spectrum above. Run the
macro-or here called SCRIPT- from HyperChem. Select Script from the top menu to
run it. This will cause all important IR parameters to be written to a default
outfile called "CHEM_IR.SCR." To re-load the IR spectrum at a later
session, first open the .HIN structure file, then go to Script and select the script that
now contains the generated IR spectrum (above this default file is CHEM_IR.SCR) . If the
IR parameters are re-loaded correctly, Compute-Vibrational Spectrum should be
active.
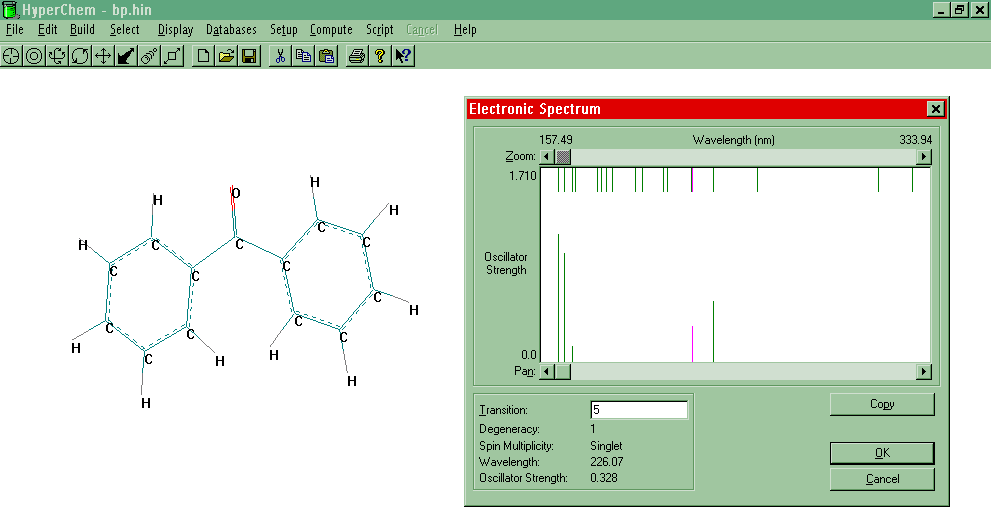
Electronic
Spectrum
- If not already done, optimize the geometric structure for
the molecule.
- Go to Setup-Semi-Empirical-ZINDO/S-Options. Set
the Total Charge to 0, Spin Multiplicity to 1, Spin pairing to RHF, and select Lowest
State. ZINDO/S is optimized for spectroscopic calculations, but other
computational methods will work as well.
- Select: CI (i.e., Configuration Interaction),
Singly Excited, Orbital Criterion should be set to 3 Occupied and Unoccupied. OK to go
back to the top menu.
- Select Compute-Single Point.
- Finally, Compute-Electronic Spectrum. The top set
of lines show both singlets and triplets, whereas the bottom set shows spectroscopically
active states and relative intensities. Highlight modes to readout information. To
see an example, click here.
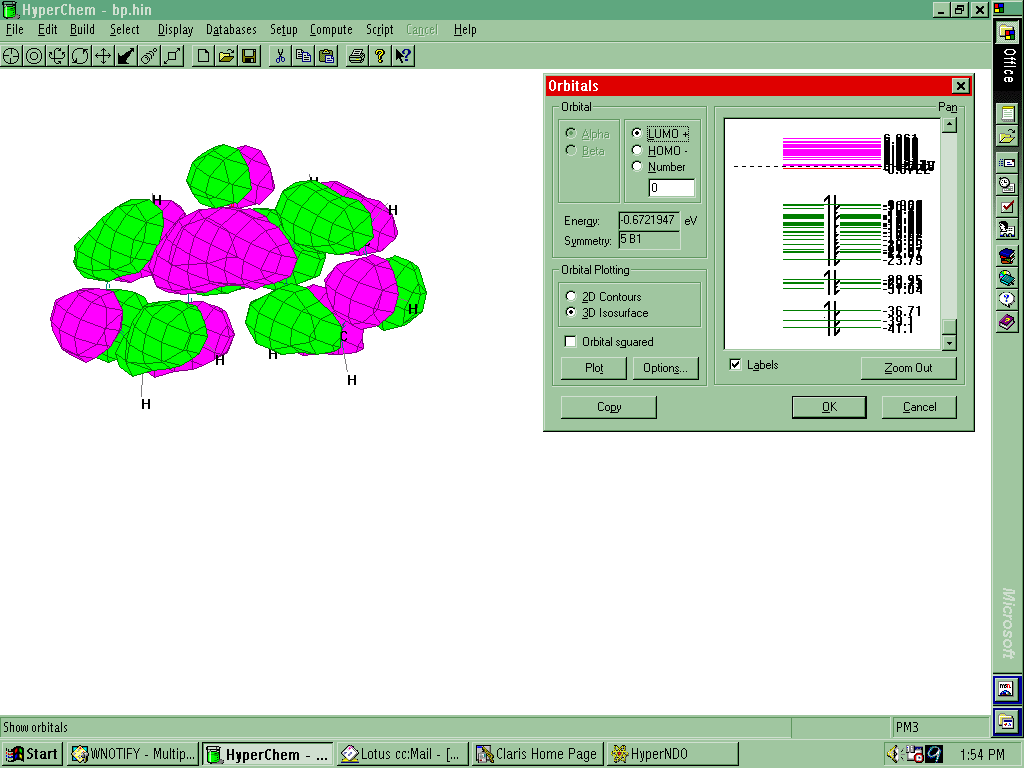
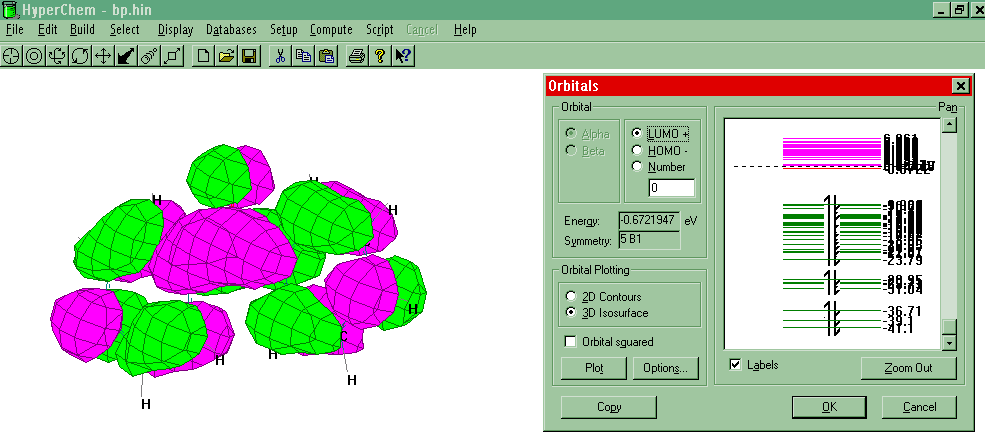
Orbitals
- Reset the Setup method to PM3 and set CI
to None. Select Compute-Orbitals. Select the Labels box to fill the
electrons in the orbitals in ascending order of energy. Pick an orbital and Plot.
(See Example.) Different orbital
rendering schemes are available under Options.
- The LUMO and HOMO are the orbitals where the valance
electrons of molecules are found. They are refereed to as the "Frontier
Orbitals". LUMO stands for Lowest Unoccupied Molecular
Orbital (the lowest energy antibonding orbital) and HOMO
stands for Highest Occupied Molecular Orbital. Select a different orbital by pointing and
clicking and Plot. Can you tell the difference between bonding and
antibonding orbitals?
Rendering Isosurfaces
- Set File- Preferences-Isosurface Colors.
For example, you might choose Red-Postive and Green - Negative.
- After a single point calculation, go to Compute-Plot Molecular Properties-Molecular
properties-3D mapped
- Rendering - Gouraud Shaded Surface.
If you want to change the maximum and minimum charge/distance ranges, first
find the maximum positive charge values: Display-Labels-Charges.
Next, go to Plot Molecular Properties menu, set the maximum positive and minimum values in
Mapped Function Options.
- To copy the output to the Windows clipboard, press F9 key. If you want to copy
directly to a file, set this option under File-Preferences-Setup Image. Select RGB
bitmap for the best resolution-but beware-the files can be large!
- Examples.