FTIR Spectroscopy
Infrared spectroscopy is an important technique in organic chemistry. It is an easy way to identify the presence of certain functional groups in a molecule. Also, one can use the unique collection of absorption bands to confirm the identity of a pure compound or to detect the presence of specific impurities.
This page will step you through the principles of operation of the FTIR Spectrometer, and how it differs from classical continuous-wave (CW) instruments. To skip directly to spectral interpretation, click here.
Continuous Wave spectrometers
Before delving into FT spectrometry, let's review the principles of a classical
spectrometer. If you have used an optical or UV spectrometer, the principles are
identical:
Although very accurate instruments can be designed on these principles, there are several important limitations. First, the monochromater/slit limits the amount of signal one can get at a particular resolution. To improve resolution, you must narrow the slit and decrease sensitivity. Second, there is no easy way to run multiple scans to build up signal-to-noise ratios. Finally, the instrument must be repetitively calibrated, because the analog connection between the monochromater position and the recording device is subject to misalignment and wear.
FT instrumentation
Now let's look at an FT instrument.
We still have a source, a sample and a detector, but everything else is different.
Now, we send all the source energy through an interferometer and onto the sample. In
every scan, all source radiation gets to the sample! The interferometer is a
fundamentally different piece of equipment than a monochromator. The light passes
through a beamsplitter, which sends the light in two directions at right angles. One
beam goes to a stationary mirror then back to the beamsplitter. The other goes to a
moving mirror. The motion of the mirror makes the total path length variable versus
that taken by the stationary-mirror beam. When the two meet up again at the
beamsplitter, they recombine, but the difference in path lengths creates constructive and
destructive interference: an interferogram:
The recombined beam passes through the sample. The sample absorbs all the different wavelengths characteristic of its spectrum, and this subtracts specific wavelengths from the interferogram. The detector now reports variation in energy versus time for all wavelengths simultaneously. A laser beam is superimposed to provide a reference for the instrument operation.
Energy versus time is an odd way to record a spectrum, until you recognize the relationship between time and frequency: they are reciprocals! A mathematical function called a Fourier transform allows us to convert an intensity-vs.-time spectrum into an intensity-vs.-frequency spectrum.
The Fourier transform:

A(r) and X(k) are the frequency domain and time domain points, respectively, for a
spectrum of N points.
| An interferogram |
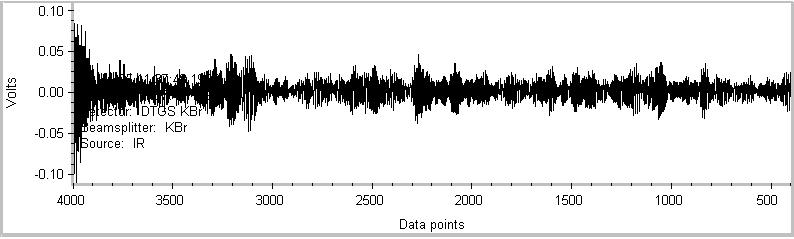 |
| A spectrum |
 |
Now, you have to do the Fourier transform for every point in the interferogram. You may like to do exponential functions by hand, but I (and most organic chemists) are far too lazy for that. Fortunately, even a slow computer can efficiently perform this operation. The output of the detector is digitized, and a small computer program will do the transform in a matter of seconds (or less). All modern FT instruments are computer-interfaced.
There are several advantages to this design:
The one minor drawback is that the FT instrument is inherently a single-beam
instrument; it cannot use the "channel ratio" trick used in CW operation.
One result is that IR-active atmospheric components (CO2, H2O) will
appear in the spectrum. Usually, a "Background" spectrum is run, then
automatically subtracted from every spectrum. The spectrum below is such a
background scan.
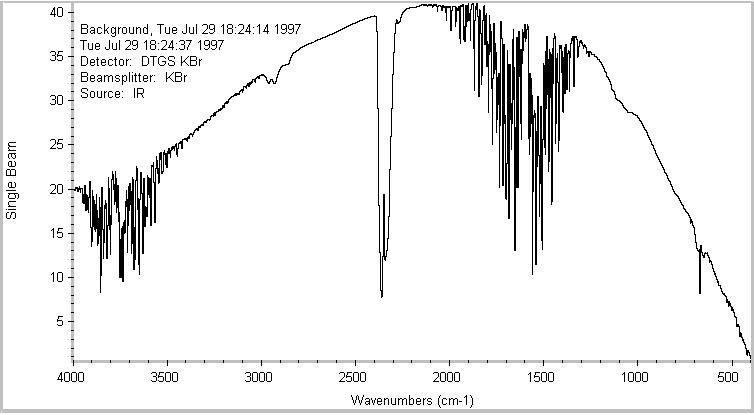
You can see CO2 as the strong doublet at around 2300 cm-1, and
water as the "spiky" peaks in the 3800 and 1600 cm-1. The
"bell curve" shape of the spectrum reflects the output spectrum of the
source: strong in the middle, but falling off at the ends.
Back to CH362 Home Page
Forward to Spectral Interpretation
Sample preparation and use of the instruments
Last updated:
01/26/2013
Comments to K. Gable