File: Fe_acac.pdb
White background
Black background
Wireframe model
Spacefilling model
Ball & Stick model
The above structure of Fe(acac)3 illustrates that hexacoordinate transition metals have ligands that lie along the three cartesian coordinates (in either direction). If we want to know about bonding, we have to consider which orbitals are involved, and what their orientation is relative to the ligand electron density lying on the cartesian axes.

The valence orbitals for first-row transition metals like iron are the 3d set:
D orbitals
By CK-12 Foundation (File:High School Chemistry.pdf, page 271) [CC BY-SA 3.0 (http://creativecommons.org/licenses/by-sa/3.0)], via Wikimedia Commons


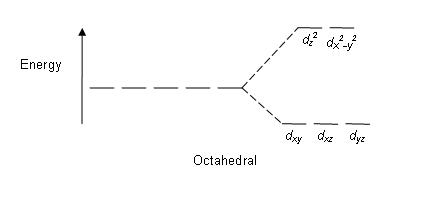
We see that two of these, dx2-y2 and d2, point to cartesian axes. In simplistic terms, an electron in these orbitals will have a higher energy due to electron-electron repulsion with the ligand than an electron in either the dxy, dxz or dyz orbitals. A more formal MO analysis has these two atomic orbitals being used to create bonding and antibonding MOs; since the ligands all donate 2 electrons each to fill the bonding MOs, any electrons starting in these atomic orbitals wind up in the antibonding MOs.

The energy level diagram thus is:
Octahedral crystal-field splitting
Source: English Wikipedia user YanA [GFDL (http://www.gnu.org/copyleft/fdl.html) or CC-BY-SA-3.0 (http://creativecommons.org/licenses/by-sa/3.0/)], via Wikimedia Commons
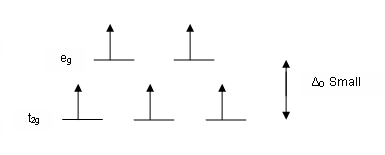
Two orbitals go up in energy, and the other three stay the same. Occupancy depends on by how much the levels split; pairing electrons costs some energy, and if the splitting energy is small (the ligand is "low field"), then we still populate everything first. If the bonding interation is large (the ligand is "high field", we fully populate the lower set before adding electrons into these antibonding MOs.

Thus, for Fe+3, the two possibilities are:

High field, Low Spin

CFT - Low Spin Splitting Diagram 2
Source: YanA at the English language Wikipedia [GFDL (http://www.gnu.org/copyleft/fdl.html) or CC-BY-SA-3.0 (http://creativecommons.org/licenses/by-sa/3.0/)], via Wikimedia Commons

Low field, High Spin

CFT - High Spin Splitting Diagram 2
Source: YanA at the English language Wikipedia [GFDL (http://www.gnu.org/copyleft/fdl.html) or CC-BY-SA-3.0 (http://creativecommons.org/licenses/by-sa/3.0/)], via Wikimedia Commons
We can tell what's happening by measuring the magnetic properties of the molecule. There will be some number of unpaired electrons in each case (here the choice is 1 or 5; this will be different in each of Cr(acac)3 and Co(acac)3). Unpaired electrons make the molecule paramagnetic, and this affects its NMR properties. Unfortunately, the direct effect is that the signals for the complex (the ligand hydrogens) are broadened to the point of being undetectable. However, the unpaired electrons are both close enough to the solvent to affect its chemical shift, but still far enough away to not broaden its signal. And the specific amount of paramagnetism affects the signal coming from the solvent.

The measure of paramagnetism is the magnetic moment μeff, expressed in "Bohr magnetons", a dimensionless number that requires using all-SI units in its determination.

If n is the number of unpaired electrons,

μeff = {n(n+2)}½

(or should be).


The greater μeff, the bigger impact on the solvent chemical shift, and the whole thing is highly temperature dependent (from density considerations among other things). To determine everything we need, we have to measure:
  • The change in chemical shift induced by a given molality (note that measurement: kg/m3) of solute in an NMR solvent; usually data is collected as the solution with a capillary of pure solvent in the same NMR tube.
  • The temperature of the solution in the NMR probe at the time the above data is corrected.
  • A correction for the intrinsic diamagnetism of the solute.
This gives us a measurement called the corrected magnetic suseptibility χMcorr which, if the units are correct, can be converted to μeff:

μeff = 797.8(TχMcorr)½