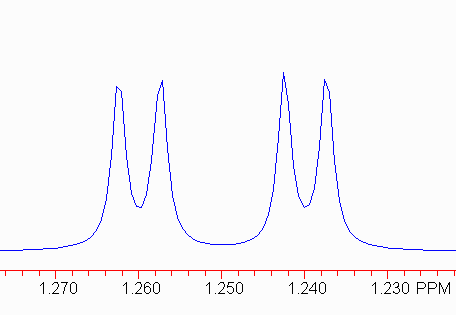
Interpolated Peak Listing
Peak Point Height Rel. Ht Hz     PPM
1    2028  825     89.43  504.84 1.262
2    2037  890     96.54  502.68 1.257
3    2061  948     102.81 496.88 1.242
4    2069  888     96.35  494.86 1.237
Measurement of the coupling constants requires the peak listing. You were given two of these, one for the low-resolution 1D proton spectrum, and one for the high-resolution expansion of the aromatic region. Use the latter. Compare this list to the spectrum to identify which peaks on the list correspond to which multiplets you need to analyze. We'll work through a couple of examples.
 |
Interpolated Peak Listing Peak Point Height Rel. Ht Hz PPM 1 2028 825 89.43 504.84 1.262 2 2037 890 96.54 502.68 1.257 3 2061 948 102.81 496.88 1.242 4 2069 888 96.35 494.86 1.237 |
This is relatively easy to analyze, if you understand the source of the splitting. The two pairs of peaks should have the same (small) coupling constant. In this case, subtracting the frequencies (in Hz) gives two measures of the small coupling constant:
504.84 - 502.68 = 2.16; 496.88 - 494.86 = 2.02.
Note that there is some uncertainty that depends on the resolution! Here, this should be interpreted as 2.1 ± 0.1 Hz. Coupling constants are rarely quoted to better than 0.1 Hz since spectrometers are rarely run with that degree of precision.
The harder part is to find the larger coupling constant. There are two equally valid approaches.
Using Method 2, we get
504.84 - 496.88 = 7.96
502.68 - 494.86 = 7.82
So, we would conclude the larger coupling constant is 7.9.
The proper means of describing this multiplet is:
1.25 dd, J = 7.9, 2.1.
(The chemical shift is the average for the multiplet.)
 |
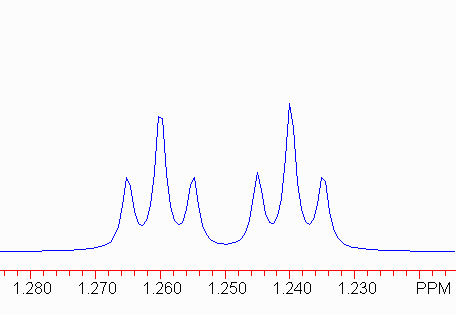
Interpolated Peak Listing Peak Point Height Rel. Ht Hz PPM 1 2024 941 21.64 505.88 1.265 2 2032 1615 37.14 503.86 1.260 3 2041 939 21.61 501.71 1.254 4 2057 989 22.75 497.93 1.245 5 2065 1907 43.87 495.90 1.240 6 2073 923 21.24 493.88 1.235 |
Remember that in a triplet, the outler two lines are symmetrically distributed with respect to the center line, so the frequency differences 1-2 and 2-3 should be the same (and identical to 4-5 and 5-6).
Therefore, the small coupling constant here is 2.1 Hz.
The larger coupling constant can be most easily found by finding the frequency difference between the two center lines of the triplets. (1-4 and 3-6 are also valid.)
Therefore, the larger coupling constant is 8 Hz. The peak would now be described as:
1.25 dt, J = 8, 2.1 Hz.
Note the order of the coupling constants: the larger coupling constant is associated with the doublet component, and the smaller with the triplet component. This is important to structure elucidation because there should be a single proton coupled to this one with J = 8 Hz, but two protons coupled with J = 2.1 Hz.
What would the pattern look like for:
1.25 td, J = 8, 2.1 Hz?
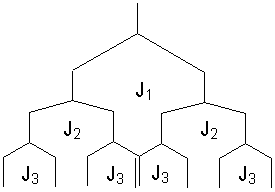
A ddd pattern should give 8 lines (assuming no overlap). Look at the splitting tree to see this:

Note that there may be some crossong of lines depending on the relative sizes of J1, J2 and J3.
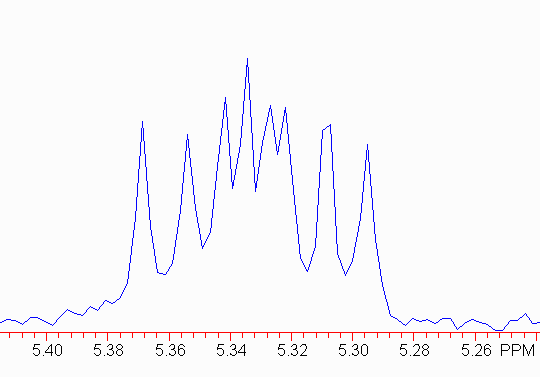
Here is a real example.
 |
Interpolated Peak Listing Peak Point Height Rel. Ht Hz PPM 1 2275 119001 3.19 1611.27 5.368 2 2281 107819 2.89 1606.90 5.354 3 2286 138248 3.70 1603.06 5.341 4 2289 169704 4.54 1600.78 5.334 5 2292 129126 3.46 1598.64 5.326 6 2294 132516 3.55 1596.60 5.321 7 2300 115989 3.11 1593.25 5.305 8 2305 110317 2.95 1589.11 5.295 |
The first thing to do is make sure the outer pairs of peaks have the same separation; this will be the smallest coupling constant. Here,
1611.3 - 1606.9 = 4.4 Hz
1593.3 - 1589.1 = 4.2 Hz
Therefore, we should find two more pairs of signals, each separated by about 4 Hz! Note:
1603.1 - 1598.6 = 4.5
1600.8 - 1596.6 = 4.2
Now, you can use the same method you used above to find the other larger coupling constants. In this case,
1-3 = 2-5 = 4-7 = 6-8 = 8.2 Hz
1-4 = 2-6 = 3-7 = 5-8 = 10.5 Hz
Don't be too worried if the numbers vary by a few tenths of a herz.