Experiment 2
CH 205 – Winter 2006
Spectroscopic Analysis of a Sunscreen Product
Introduction
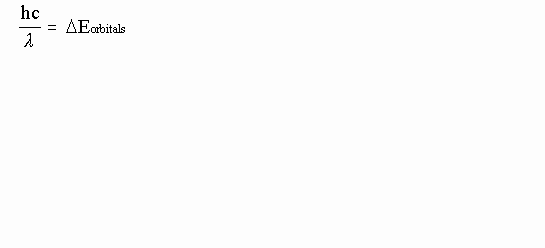
You have seen in lecture that electrons reside in atomic or molecular orbitals. To occupy a specific orbital the electron must have a specific energy. Like electrons, many things in the natural world are restricted to specific, or quantized, energies. Light, for instance, has a set relationship between its wavelength (8) and its energy (E): E=hc/8. Virtually everything we know about atoms and molecules, and techniques as seemingly unrelated as magnetic resonance imaging (MRI) and microwave ovens, comes from an understanding of how specific wavelengths of light interact with the matter they bump into.
Atoms and molecules have a variety of orbitals to house electrons. To move between orbitals an electron must attain the energy of the new orbital. Electrons can go from high- to low-energy orbitals, in which case they emit the excess energy, or they can go from low- to high-energy orbitals, in which case they absorb the energy they need to make the transition. The energy absorbed by the electrons can come from light waves - but not just any wavelength will do. Since all orbitals have a specific energy, the energy difference, )E, between orbitals is exactly fixed. Thus, even though there may be plenty of light around, most of it is useless for electronic transitions. Electrons can use only the wavelengths of light whose energy exactly matches the energy difference between their orbitals. The condition for electronic transitions between orbitals can be stated in an equation:
Energy of light wave = Energy difference between orbitals
So atoms and molecules are very selective when they absorb light. You could say they act like ‘light-filters’. You may be familiar with how a water filter can remove certain particles from a stream of water without interrupting the flow. In a similar way atoms absorb light of specific wavelengths while the rest of the wavelengths pass right through. In this lab you will observe molecules acting like filters in what we call an absorption experiment. You will place a molecular solution in a beam of light and record which wavelengths the molecules absorb (filter out).
It is important to note the difference between the energy (wavelength) of a wave and the intensity (brightness) of the beam. As stated above, the energy and wavelength are related by the equation E=hc/8, which means that a given wavelength of light has a fixed energy. We cannot change it. The intensity of a beam of light, however, can be altered because the intensity refers to the number of copies of a given wavelength in the beam; the more copies, the more intense, or bright, the beam will be. Each time an electronic transition takes place it removes one copy of that wavelength from the beam. Each copy of a wavelength in a beam is called a photon. Since a photon is just a single copy of a particular wavelength of light, the energy of a photon is determined by the wavelength of the light (E=hc/8).
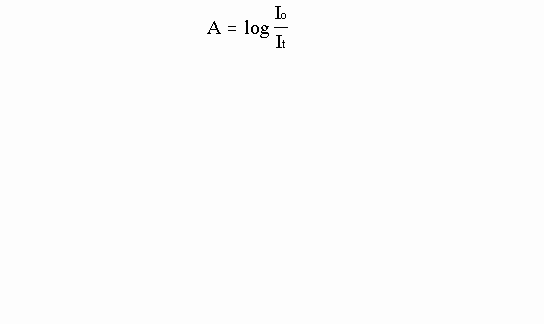
An atom or molecule absorbs a single photon when an electron makes a transition to a higher energy orbital. Thus the number of photons a sample absorbs is directly related to the number of atoms (or molecules) in the path of the beam of light. This is a very important concept because it means that by measuring the change in intensity, or number of photons (I), of a beam of light before (Io) and after (It) it passes through a solution we can determine the number of atoms (or molecules) in the solution. The intensity change should be related to the number of atoms or molecules the beam encounters. More technically, the log of the ratio of It to Io is called the absorbance (A).
The relationship between absorbance and the concentration of a sample can be expressed mathematically by Beer’s Law:
![]()
The fundamentals we guessed are here in Beer’s Law; A, the absorbance, is proportional to C, the concentration (the number of molecules per liter). The more concentrated a sample is, the higher will be its absorbance. The other two symbols represent constants. "R" is the length of the sample container, and "g", the extinction coefficient, is a fudge factor to account for efficiency of absorption and other details. The extinction coefficient is different for every compound. The units of g vary. The absorbance is dimensionless so the extinction coefficient carries units to cancel whatever concentration and length units are used. In this experiment we will use g/mL (which is the same as g/cm3) for concentration and a sample length of 1 cm.
When you lather on sunscreen you’re spreading a chemical on your skin that absorbs in the ultraviolet (UV) region of the electromagnetic spectrum. Ultraviolet radiation can be harmful to the skin. It can damage genetic material near the skin’s surface and lead to skin cancer. Because molecules can act as filters, the right molecules can filter out the harmful radiation from the sun. That is basically how sunscreen works. It contains molecules that absorb strongly in the UV region. Your body’s natural defense to UV light is also to produce filter molecules. The compound melanin is produced in skin cells and absorbs strongly in the UV region. Melanin pigments your skin, resulting in darker skin (a "tan") after exposure to sunlight. The sunscreen industry markets its products with SPF (Sun Protection Factor) ratings. We can test the various SPF ratings by measuring their absorbance.
Experimental
Work in groups of two.
Sunscreens are mixtures of many compounds. You will measure the absorbance of the whole mixture rather than the separate components. First you will dissolve the sunscreen in ethanol. Then you will make a series of ethanol solutions with different concentrations by diluting your original solution. You can then measure the absorbance of the different dilutions and plot the absorbance of the sunscreen vs. concentration to calculate the extinction coefficient. You’ll compare extinction coefficients of the various SPF factors to determine the relative effectiveness at absorbing UV light.
1. Obtain a 50.00 mL volumetric flask from your TA. Rinse the flask twice using a few milliliters of 95% ethanol. The 95% ethanol can be found in small carboys on the reagent benches. Dispense what you need into a small beaker, 60 mL should be enough, and take it back to your work area. Collect the used ethanol generated in this experiment in another small beaker. It will be disposed of in a specially marked container in the hood - do not pour it down the sink.
2. Clean and dry a 50 mL beaker. Using the digital balances, tare the beaker (your TA can show you how to do this) and add about 0.06 grams of your sunscreen product to the beaker. It is not critical to have exactly 0.06 grams but it is critical to know exactly how much you have (your mass should have 4 decimal places, e.g. 0.0625 g). Be sure to write the brand of sunscreen and SPF in your lab notebook.
3. Add about 30 mL of 95% ethanol to the beaker. Using one of the hotplates that are set up in your lab area, gently heat the contents of the beaker until all the sunscreen has dissolved. Be careful not to overheat the sample.
4. Once all the sunscreen is dissolved transfer the solution to the 50.00 mL volumetric flask. Add a few milliliters of 95% ethanol to the beaker, swirl, and add this rinse to the 50.00 mL volumetric flask (this will ensure that all the sunscreen is transferred to the flask).
5. Add enough 95% ethanol to fill the flask exactly to the line on the neck of the flask (bottom of the meniscus on the line). You may want to use a plastic pipet (available on the reagent benches) to fill the flask to the line. Stopper the flask and thoroughly mix the contents by inverting the flask at least 10 times. This is your stock solution..
6. Use your mass from step 2 to calculate the mass of sunscreen per mL of ethanol. Record your result keeping careful track of units.
7. Pour about 4 mL of your stock solution into a clean, dry test tube and about 4 mL of 95% ethanol into another clean, dry test tube. Your TA will show you how to measure the absorbance of the solution at 340 nm using the Spectronic 20 spectrophotometers that are set up in the lab. The tube of 95% ethanol will be your "blank", essentially a solution that contains everything (in this case only ethanol) except the analyte (the substance you are analyzing - in this case, sunscreen). The absorbance reading for your stock solution should be between 0.6 and 1.0 absorbance units. If it is significantly out of this range consult with your TA before proceeding.
8. When your stock solution is within the correct absorbance range, rinse a buret twice with a few milliliters of 95% ethanol followed by a rinsing with a few milliliters of your stock solution. The stock solution rinse is to make sure that any remaining liquid in the buret is your stock solution and won’t affect the concentration of the stock solution you’re about to add. Fill the buret with your stock solution and clear any air bubbles from the tip by allowing a small amount of the liquid to flow quickly from the tip into your waste beaker. If you still have air bubbles consult your TA.
Making the dilutions:
9. Label six clean, small test tubes 1-6. Make a table like the one below in your lab notebook. Fill each of the test tubes according to the table below using the burets to accurately measure the volumes required. Complete the missing entries.
|
Tube |
mL stock sol. |
mL 95% EtOH |
dilution factor |
g sunscreen/mL |
|
1 |
4.00 |
0.00 |
4.00/4.00=1 |
|
|
2 |
3.00 |
1.00 |
3.00/4.00=0.75 |
|
|
3 |
2.50 |
1.50 |
||
|
4 |
2.00 |
2.00 |
||
|
5 |
1.50 |
2.50 |
||
|
6 |
0.80 |
3.20 |
10. Obtain a Spec Tube from your TA and use it to reblank the spectrophotometer with 95% ethanol. Now, using the Spec Tube, measure the absorption of each of the six solutions from step 9 beginning with the most dilute solution (#6) and ending with the most concentrated (#1). Rinse the Spec Tube by pouring a small amount of the solution into the Spec Tube, swirling it around, then pour it into the waste beaker. Pour the remaining solution from the test tube into the Spec Tube and measure the absorbance. Record the results in your lab notebook. Return the solution to the original test tube (in case you need to make these measurements again) and repeat this procedure with the other five solutions.
11. Using Excel make a Beer’s Law plot of your absorption data at 340 nm vs. the concentration of your six solutions. Determine the slope of the best fit line using a linear regression (Excel can do this). Print a copy of the graph, with the linear regression information, for each partner to include with their lab report.
12. Calculate and record your value for g, the extinction coefficient (including units!), along with the brand and SPF of the sunscreen you analyzed, on the blackboard. When the entire class’ results have been tabulated write them in your lab notebook. You will need them to complete the lab report for this experiment.
To answer Question #1 you will need an absorption spectrum (a plot of "Absorption vs Wavelength") from 250 nm to 400 nm for several different sunscreen products. One of the scans will be for dilution number 6 of the sunscreen product you chose. You will need scans for three of the following Coppertone SPF 4, 15, 30, 45 and a corresponding one from a cheaper brand such as No-Ad SPF 30 or 45. This is four scans total. Example: If chose Coppertone SPF 15 you will need to find other groups in your section that have done Coppertone 30 and 45 and No Ad 30 or No Ad 45.
The Absorption vs Wavelength measurement will be made with the MeasureNet stations and spectrometer.
1. Turn on the mounted MeasureNet box and make sure the station is "online". If the screen shows "offline" turn the box off and then on again. If it still says "offline" get assistance from your TA.
2. Press the "Main Menu" button. Choose F5 "Spectroscopy" and then F2 "Absorption (1)".
3. Select the option "setup" and then F1 "Set Limits for New Acquisition". Set Ymax to 1.0, Ymin to 0.0, Xmax to 400, and Xmin to 250. The arrow keys are used to select the graph axis. (The F2 option can be used later to replot the data with different limits if needed.)
4. Press the "Display" button once the axis limits are set.
The station should now be ready to accept data from the spectrometer.
5. Go to the spectrometer. Make sure it is "online" and Enter your station number(#).
The spectrometer should show "Station # Abs ZRS" as the top line. The first two items tell the user the number of the station where the data will be sent and that the spectrometer is in absorption mode. ZRS refers to Zero or no light, Reference, and Sample. The second line should read "Ready to Scan".
6. Place the black beam blocker into the spectrometer and press the Zero button. With the beam blocker in the spectrometer all light is blocked from the detector. When you press Zero you are setting the 0% transmittance (or complete absorbance) value. When the spectrometer has finished this process remove the beam blocker and replace it with a cuvette filled with 95% ethanol. Press the Reference button. This sets the 100% transmittance (or zero absorbance) value. When the spectrometer finishes this process pour the ethanol into the waste beaker, add a small amount of solution #6 to the cuvette and gently swirly to rinse all sides. Pour this rinse into the waste beaker and fill the cuvette with solution #6. Press the Sample button. When the spectrometer finishes processing remove the cuvette from the spectrometer and return to your MeasureNet station. The MeasureNet station box will show a plot of the absorbance spectrum.
7. To save the spectrum press the "File Options" button and then F3, "Save". Give the file a 3 digit "name". The file will be stored as "Sta#xyz", where # is the number of the MeasureNet station you used to collect the data, and xyz is the three digit name you gave the file. For example Sta10003.txt is a data file from station 10 that was given the name 003. When you preform the next run make sure you use a different three digit name or you will overwrite the first file. The file, a text file, can be accessed from any computer in the lab. Turn on a computer and log in using gbad209 as the user name, ch3mistry as the password, and Science as the domain. Once the computer boots up double click on the "My Computer" icon and then on the "Q:\" drive icon. Your data will be stored under the folder for your lab section (10, 11, 12, etc...). The text files can be opened, plotted, and printed in Excel. Refer to the Excel spreadsheet lab of last quarter or ask your TA if you have trouble plotting and printing.
8. The spectrum can also be printed from the MeasureNet station using the "File Options" button. Choose F1, "Print Standard", enter the # of copies needed, and then press the Enter button. The plot will go to the printer for your lab section.
Waste Disposal
Dispose of all solutions containing ethanol in the designated containers located in the hoods.
Questions
1) Briefly discuss UVA, UVB, and UVC radiation and how it relates to the spectra of the different SPFs you have.
2) Are any of the SPFs more effective than others in particular areas of the UV spectrum? Why or why not.
3) Did you observe any particular relationship between extinction coefficients and SPF values? Did you expect one? Why or why not.