You are here: start » book » mathcontent » surfaces
There are many ways to describe a surface. Consider the following descriptions:
- the unit sphere;
- $x^2+y^2+z^2=1$;
- $r=1$ (where $r$ is the spherical radial coordinate);
- $x=\sin\theta\cos\phi$, $y=\sin\theta\sin\phi$, $z=\cos\theta$;
- $\rr(\theta,\phi) = \sin\theta\cos\phi\,\xhat + \sin\theta\sin\phi\,\yhat + \cos\theta\,\zhat$;
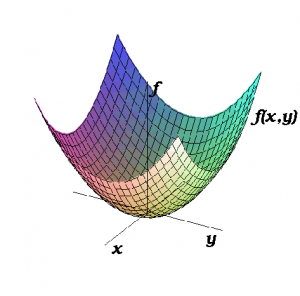
- The graph of $z=x^2+y^2$;
- The figure shown at the right.
